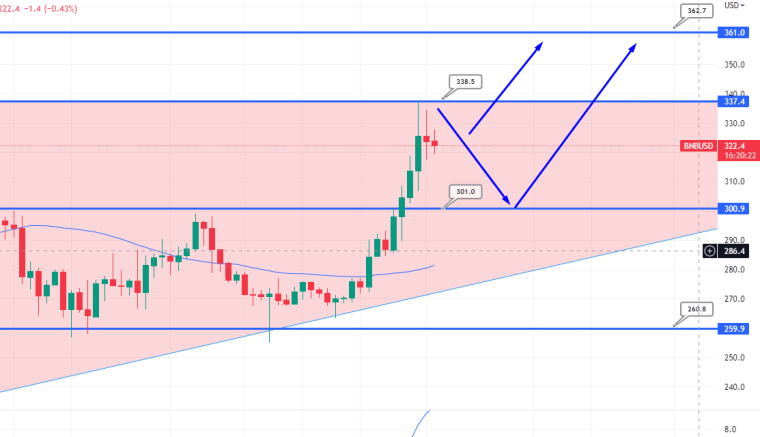
BNB price prediction remains bullish, but it must break above the $338 triple-top resistance level. Overall, BNB has exhibited a 20% weekly gain to $338 and a subsequent drop back to the $320 level. Binance CEO Changpeng Zhao recently revealed that the National Bank of the Republic of Kazakhstan would join BNB Chain with its own central bank digital currency (CBDC).
Binance Cash Price & Tokenomics
The current BNB price is $321, and the 24-hour trading volume is $1.1 billion. In the last 24 hours, BNB has dropped nearly 2%. CoinMarketCap currently ranks #4, with a live market cap of $51 billion. It has a maximum supply of 200,000,000 BNB coins and a circulating supply of 159,977,964 BNB coins.

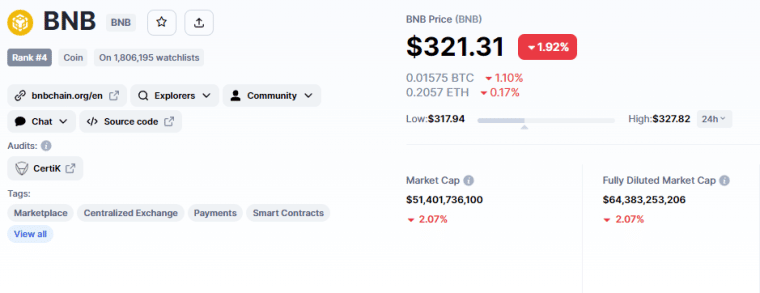
It has a circulating supply of 159,978,060 BNB coins and a maximum supply of 200,000,000 BNB coins. On November 2, the BNB/USD pair opened the day at $327.8, reaching a high of $327.8 before falling to a low of $319.3.
Binance Has Launched the Native Oracle Network
Binance, the largest cryptocurrency exchange by trading volume, released its native oracle service on October 26. This will allow smart contracts to work with real-world inputs and outputs, beginning with the BNB Chain ecosystem.
If Binance‘s claim is true, some 1,400 BNB Chain apps will immediately gain from the oracle service. As of this writing, 10 BNB Chain initiatives are now part of the Binance Oracle network. However, the service is not specific to any one blockchain and will expand to include others in the future.
Binance oracles would aggregate price data from other centralized cryptocurrency exchanges to assure accuracy. The Native Oracle Network is widely held to benefit the native cryptocurrency BNB.
BNB Price Prediction – Set to Flip Resistance to Support at $328 – $400 Next?
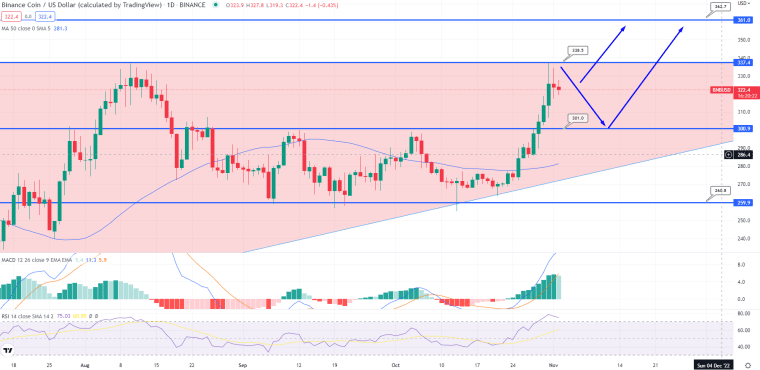
On the daily chart, BNB has established an ascending triangle pattern, which normally breaks out on the higher side. Furthermore, the RSI and MACD indicators point to a purchasing trend. Above the $280 support level, the 50-day moving average is sustaining the purchasing trend. Having said that, the positive bias remains strong; nevertheless, if BNB breaks through the $340 mark, one should consider purchasing. Elsewhere, bearish bias remains strong under $338.