The Cardano (ADA) token marked a two-year low at $0.239 as recently as December 30 but has since experienced a sustained upswing that catapulted the price to $0.264 at press time. Within the last 24 hours, ADA is recording an increase in price of around 5%, with a trading volume of around $250 million.
However, a look at the 1-day chart reveals that Cardano is far from out of the woods. The ADA price has been in a falling trend channel since mid-August 2022. Since early December alone, the ADA token has fallen 25%.
While the 50-day simple moving average (SMA) is an initial target at $0.291, ADA needs another boost above $0.33 to break out of the bearish trend. Thus, today’s move could mark a budding momentum for the bulls. The MACD indicator was showing a bullish crossover a few days ago, suggesting buying pressure is building up.
Meanwhile, the Relative Strength Index (RSI) is currently at 46 and is now in neutral territory after spending much of the second half of December in oversold territory.
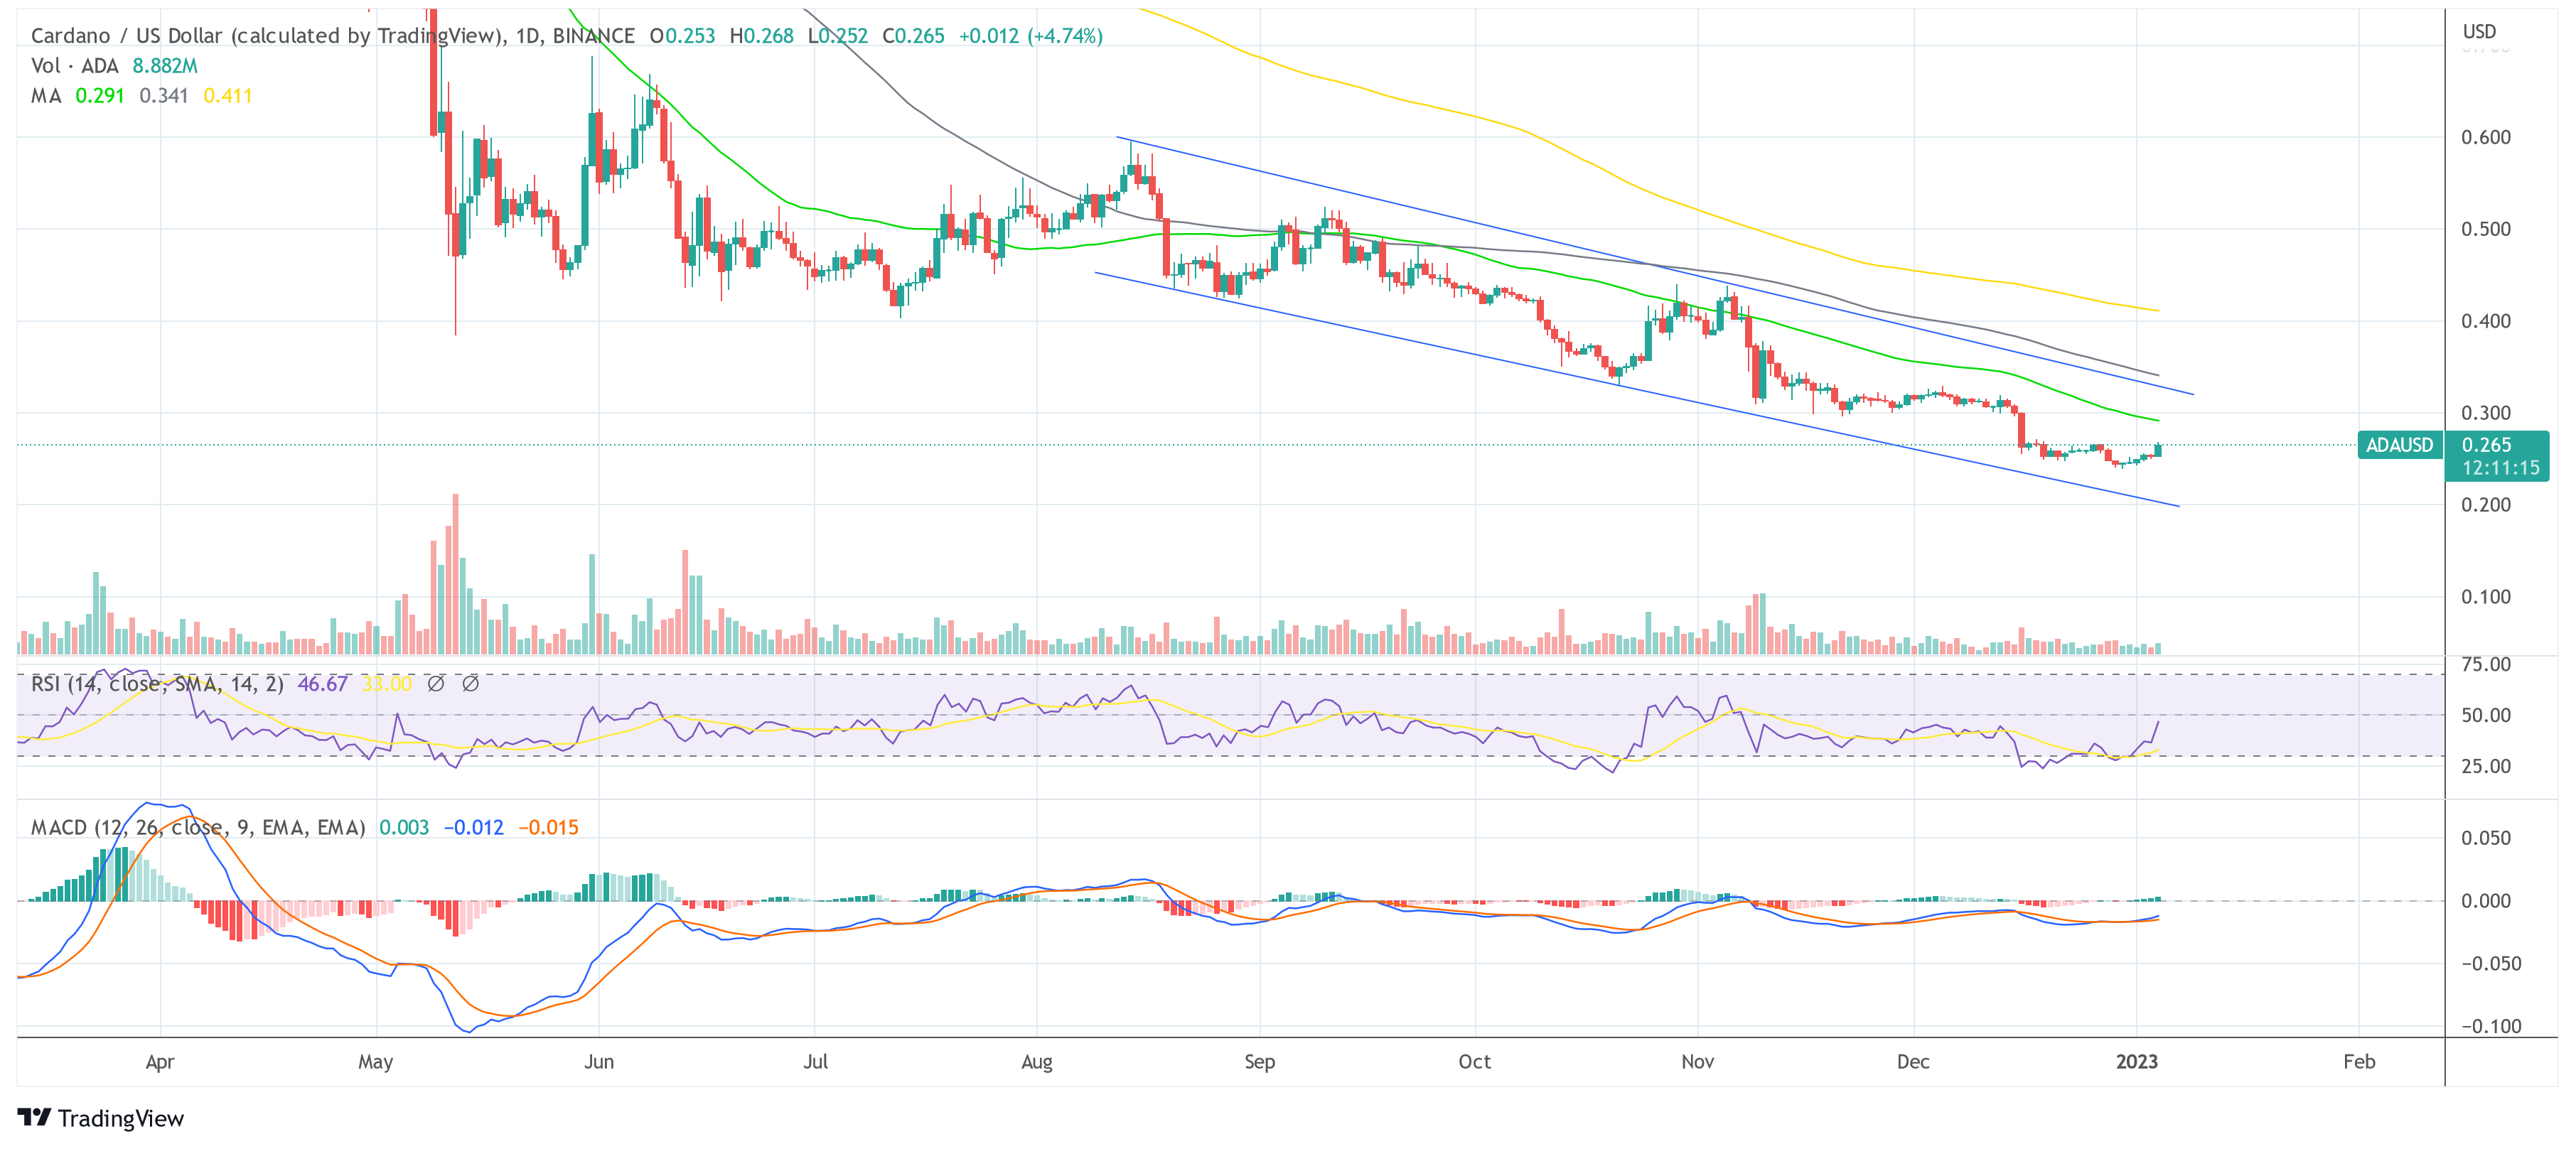 ADA / USD price, 1-day chart
Looking at the 4-hour chart, Cardano has seen a major rejection at the key resistance zone of $0.266-$0.271. For ADA investors, the mark could be the first major step to tackling the $0.28 level. After that, the most crucial resistance would be waiting in the $0.291-$0.30 zone. Only if Cardano manages a breakout, the attention could move to the higher time frame, setting up a final strike against the bearish trend.
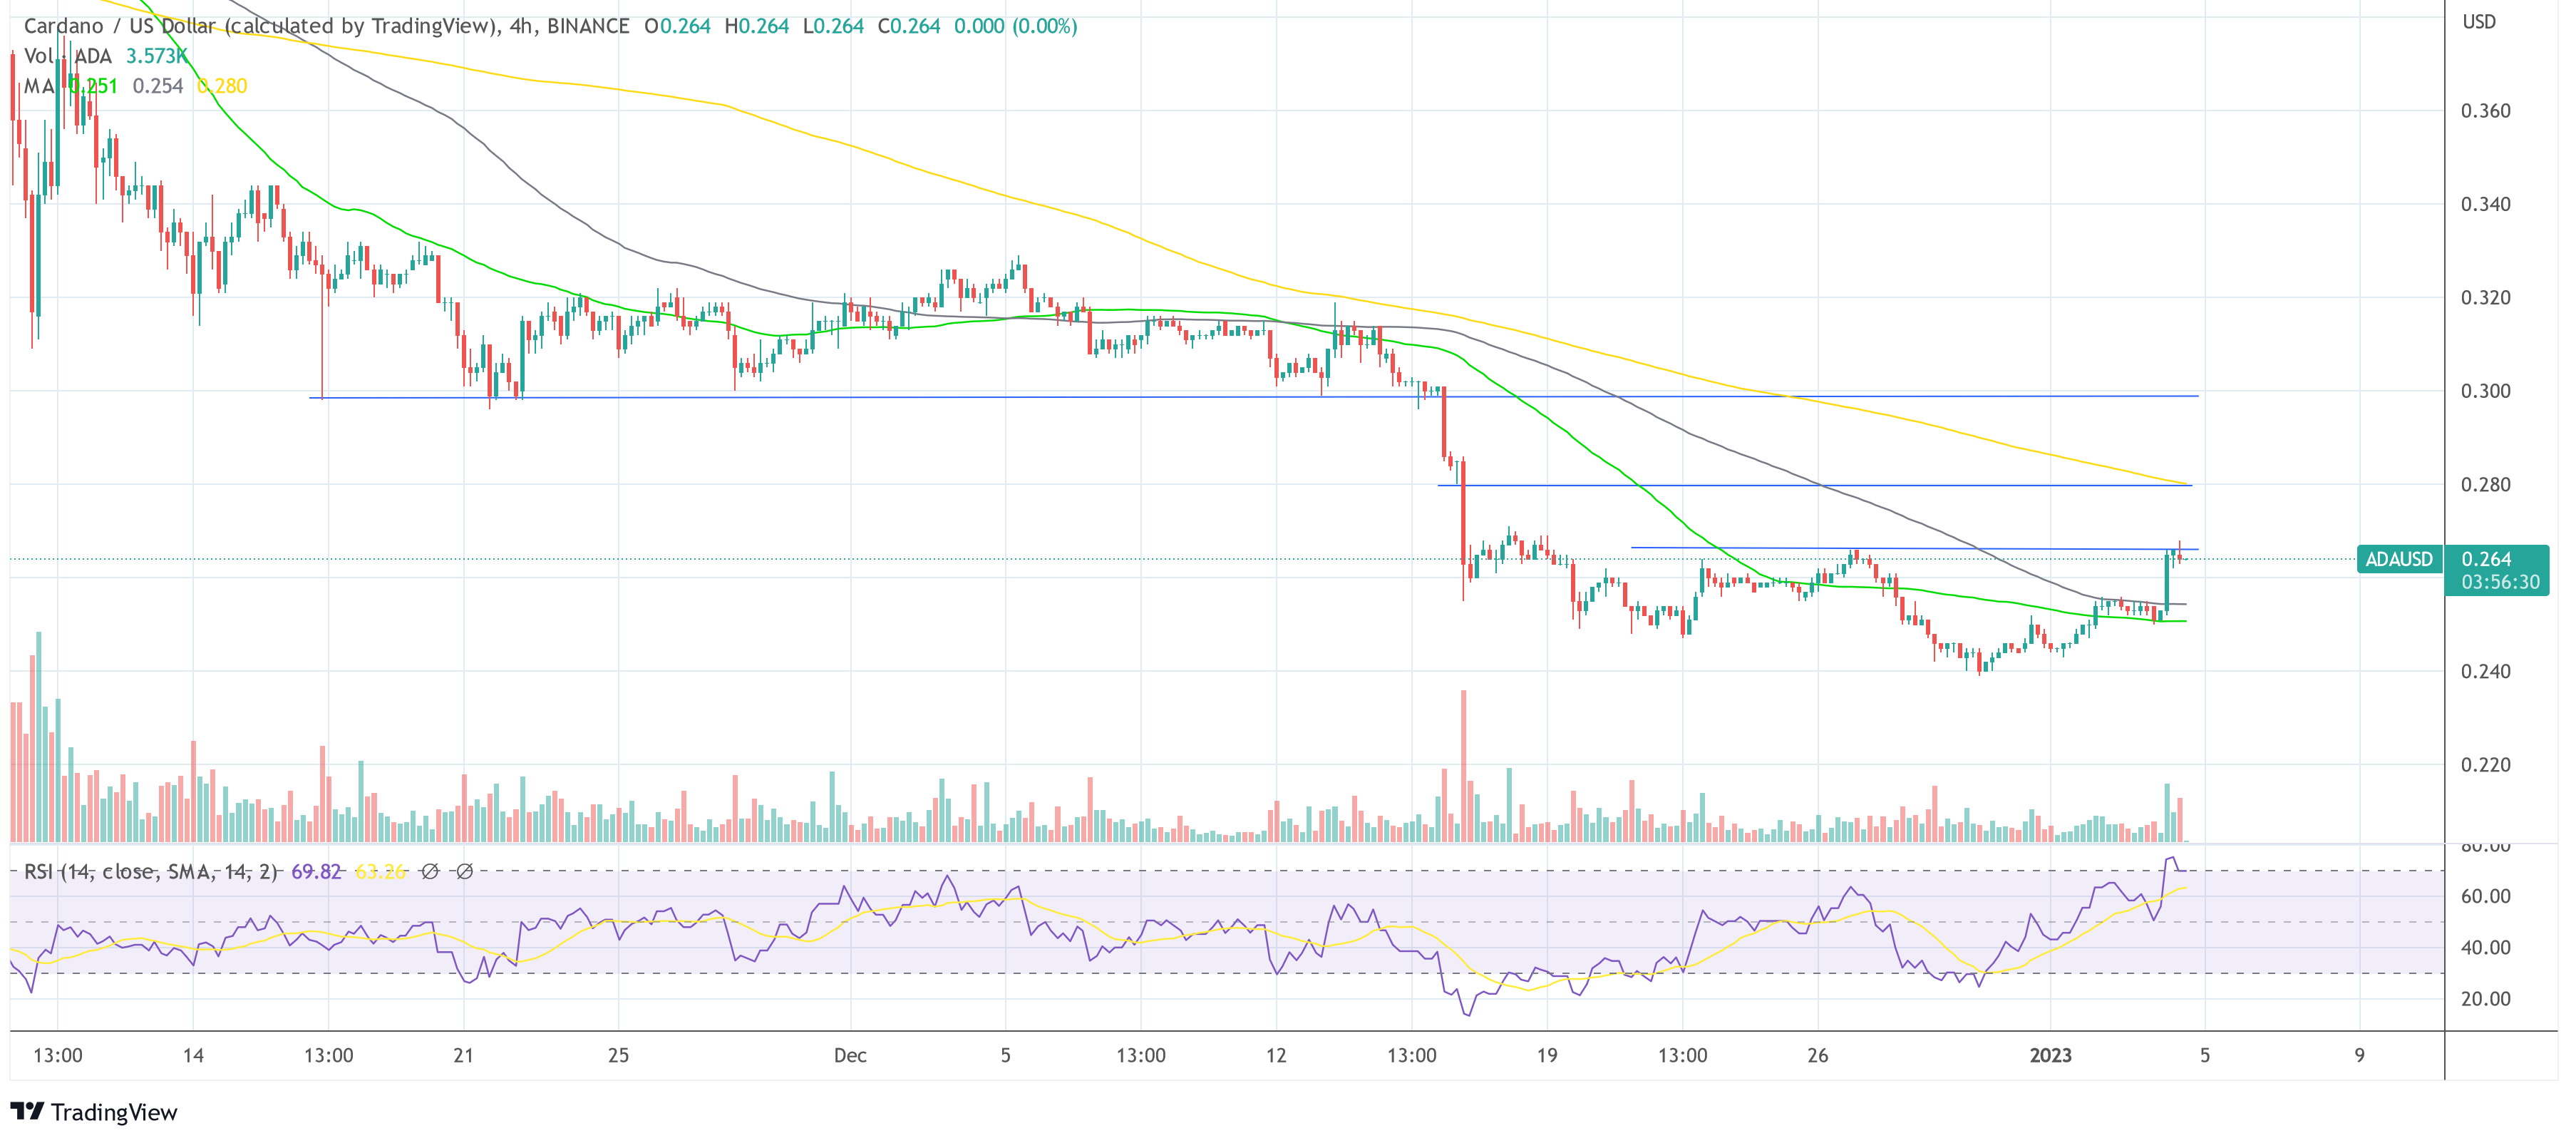 Cardano/ USD price, 4-hour chart
Cardano Whales And DeFi Activity Could Spur The Price
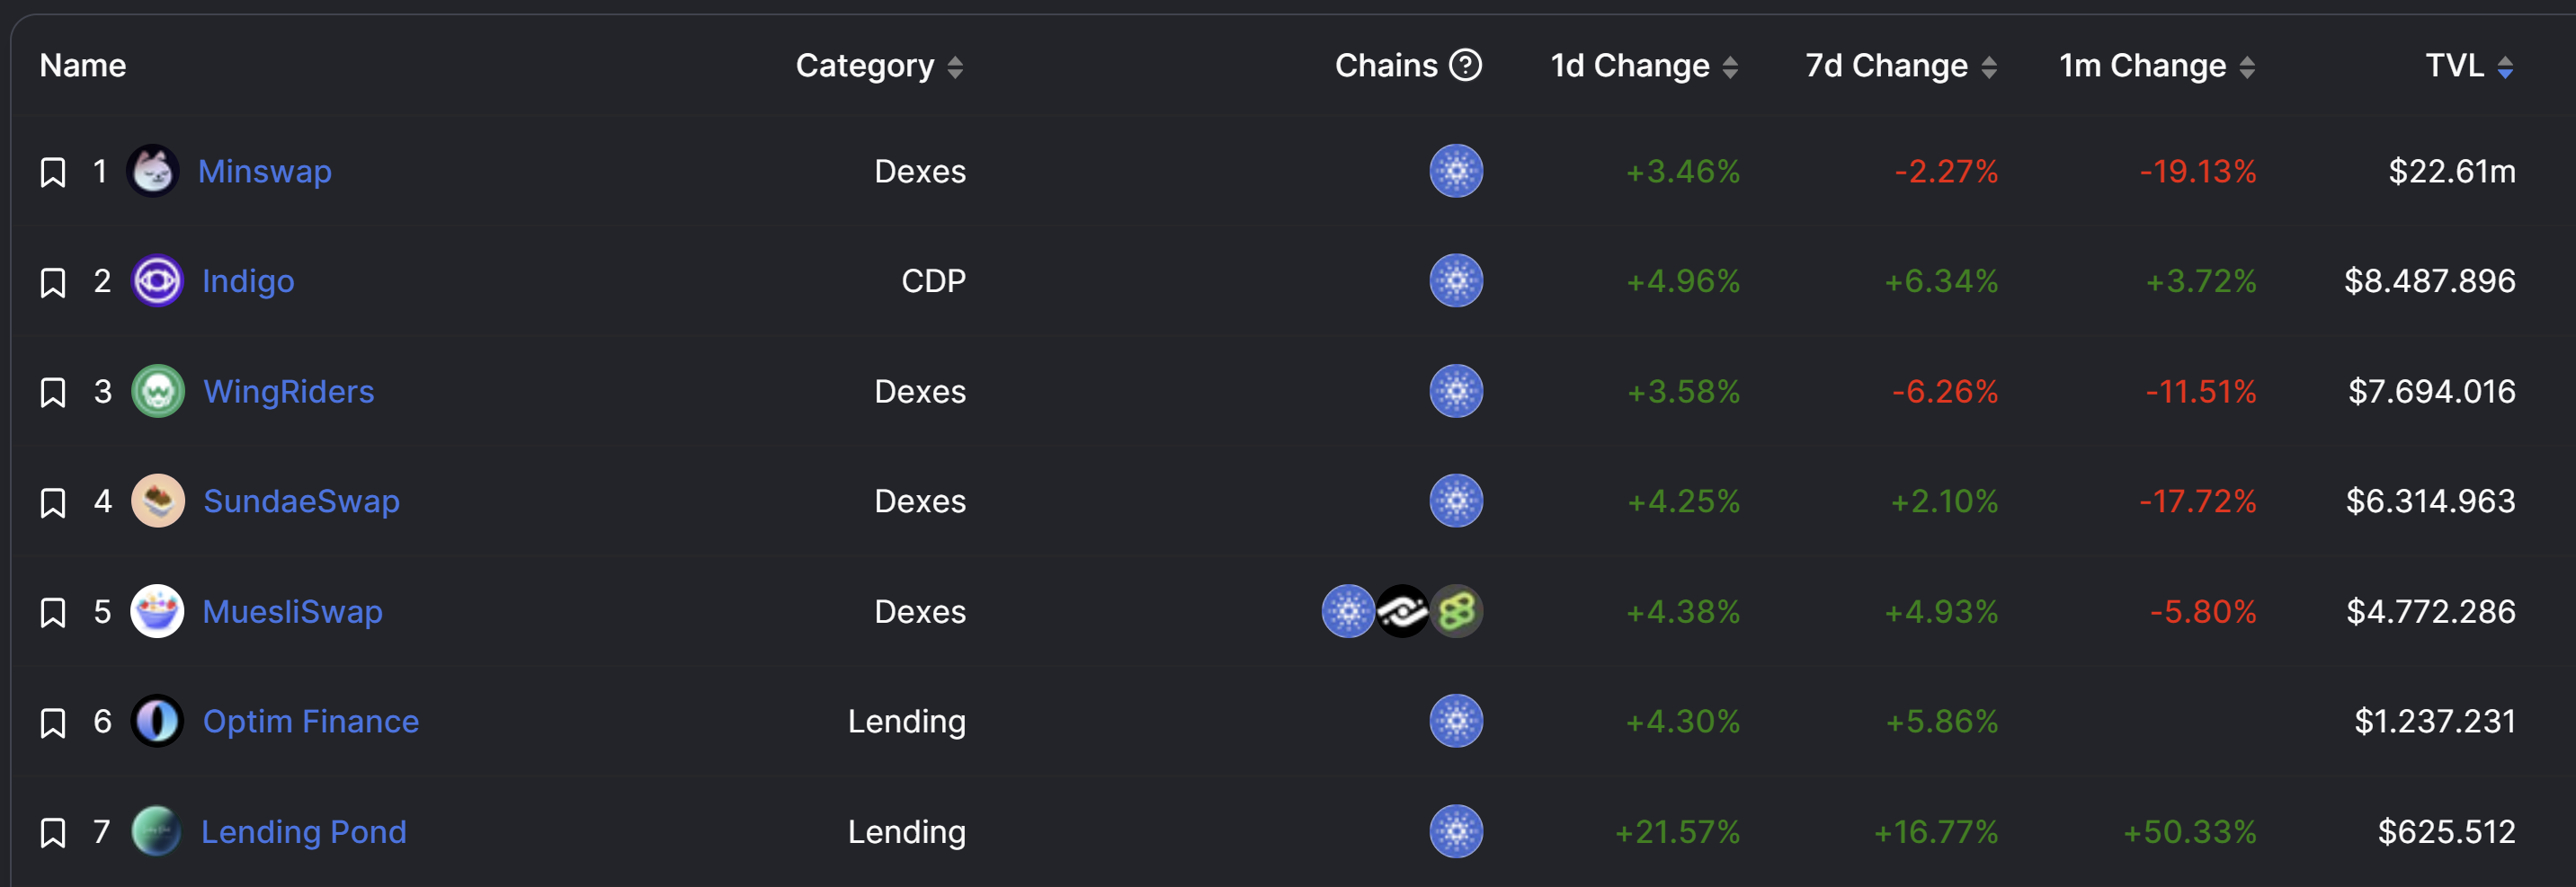
Some upside to the ADA price may have been provided by the growth of the Cardano DeFi ecosystem. After hitting a low of $48.95 million on January 1, Total Value Locked (TVL) has risen again today to $52.53 million according to data from DeFiLlama.
Some of the leading decentralized financial protocols on the Cardano network have seen an uptick in activity. Within the top 7 decentralized applications (apps), all have seen at least a 3.5% increase over the last 24 hours in terms of TVL. With +21.5%, Lending Pond leads the growth over this period, but also over the last month (+50%).
 Cardano defi dapps TVL, according to DeFiLlama
Another reason for the uptick in price could be larger ADA investors. WhaleStats data shows that large BSC holders also have a keen interest in buying Cardano (ADA). ADA purchases are within the top 10 of the 4,000 largest BSC whales in the last 24 hours. In addition, the largest BSC whales currently hold 19.9 million ADA, which is worth $5.19 million and represents 0.68% of the total supply.
Featured image from IOHK Blog, Charts from TradingView.com
Related Posts

Vital Levels To Keep Eye On As Cardano Price Begins To Retreat
Cardano Up 30% Since December As 28 New Whales Hold At least 1 Million ADA
Cardano Follows Bullish Sentiment, Why ADA Could Become Top 3 Coin
Cardano (ADA) Up Nearly 20%, Aiming For A Higher High?
Cardano (ADA) Leads Gains Among Top Coins, Is It Set To $0.50?
Cardano (ADA) Extremely Undervalued? On-Chain Data Suggests So
Premium Partners


Top Casinos
BitStarz
Punt Casino
Trust Dice
Metaspins
Coinplay
CryptoSlots
mBit
Vave
Sportsbooks
1xBit
Coinplay
This Needs To Happen For Bitcoin And Ethereum To See A Bullish 2023
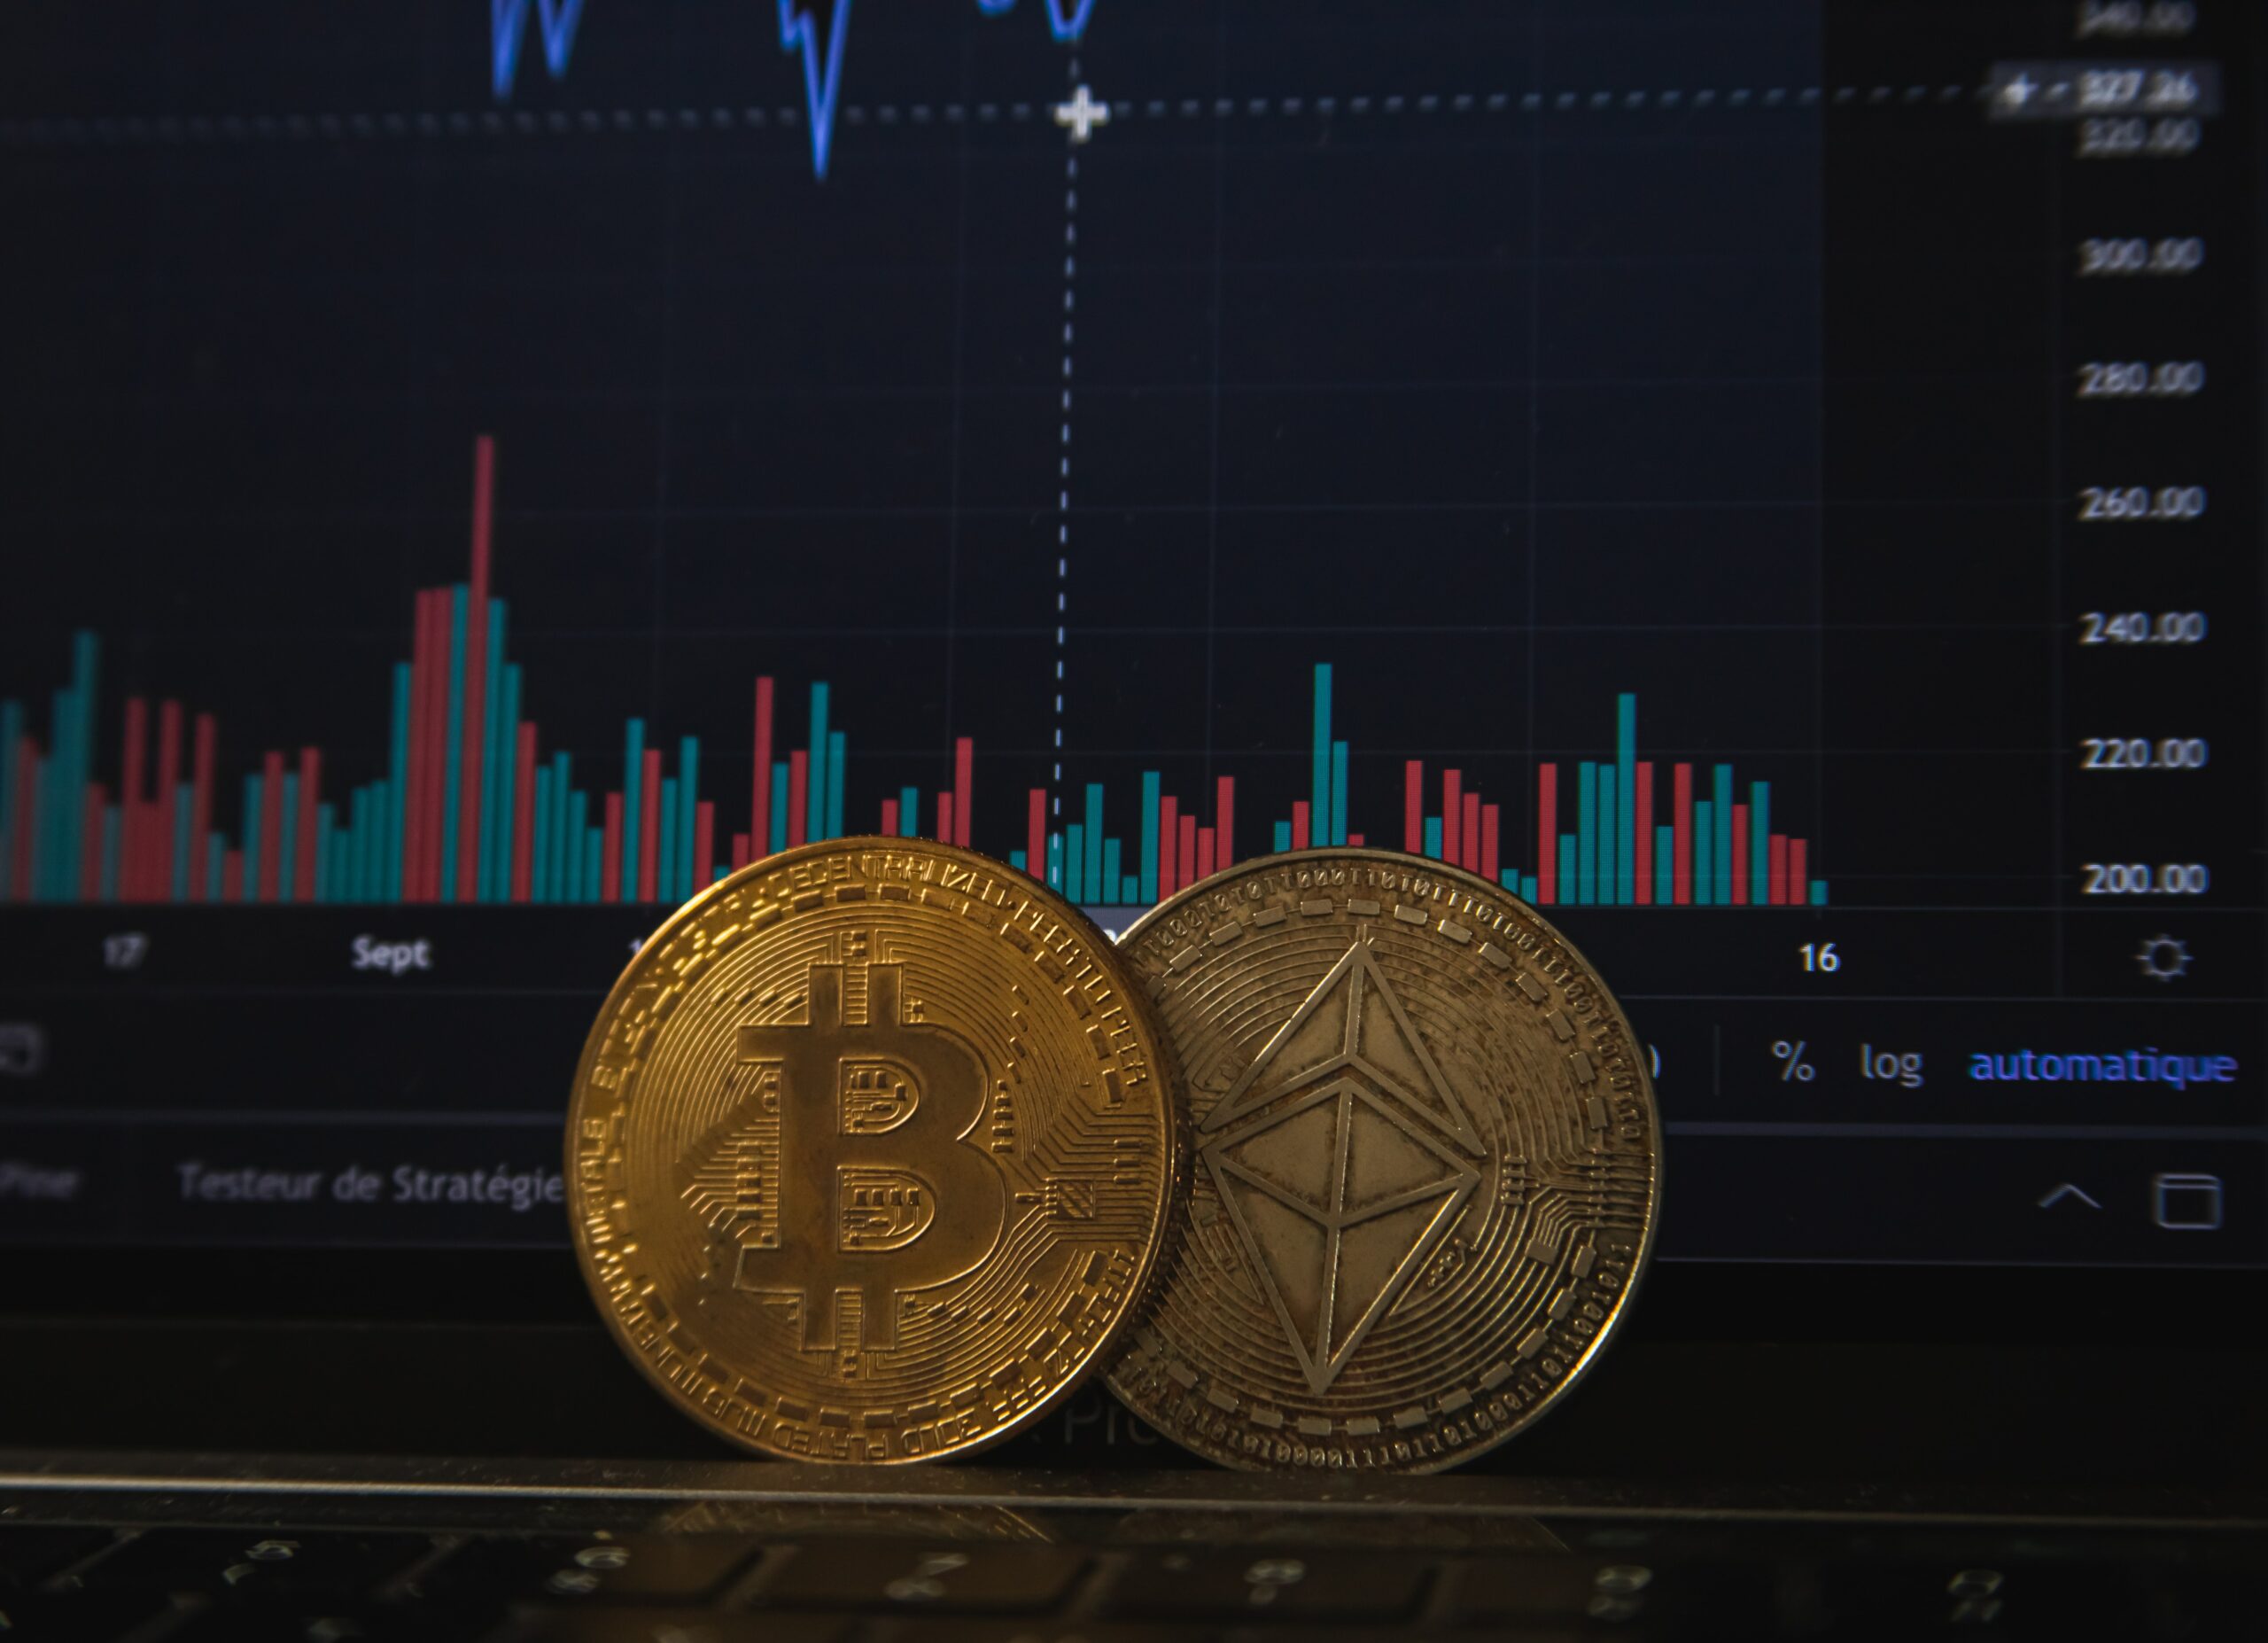
The year 2023 is starting off better for Bitcoin and the broader crypto market than last year ended. Even though most crypto prices are still trading in a very depressed, narrow range, BTC is at least showing a year-to-date performance of 1.55% and Ethereum of 4.5%.
However, as QCP Capital writes in its latest market analysis, there are early signs that should caution crypto investors. While the gold price is currently performing extremely strongly, the trading firm raises the question of whether this will continue if the expected wave five of the USD rally takes place based on the Elliott wave theory.
According to the theory, the fifth wave is the final leg in the direction of the prevailing trend. And a resurgent USD could mean further price losses not only for gold but also Bitcoin and crypto. As QCP Capital elicits, it remains to be seen if this will impact the other alternative asset classes as well.
Currently, total liquidity in the market, as measured by M2 money supply annual growth, has shrunk to 0% for the first time in history. “Not to mention the liquidity within crypto itself which is an even smaller factor of that,” the firm states based on the following chart.
Price Targets For Bitcoin And Ethereum
Nonetheless, Bitcoin and Ethereum are in somewhat of a catch-up rally at the beginning of the year, much like gold. Despite the mini-rally, BTC is still trading in an extremely tight falling wedge, with 18k as the key breakout level on the upside, according to the firm.
In the medium-term, $28,000 is looking more and more key – as the head and shoulders neckline, and 61.8% fibonacci retracement level of the $3,858 2020 low to $69,000 2021 high.
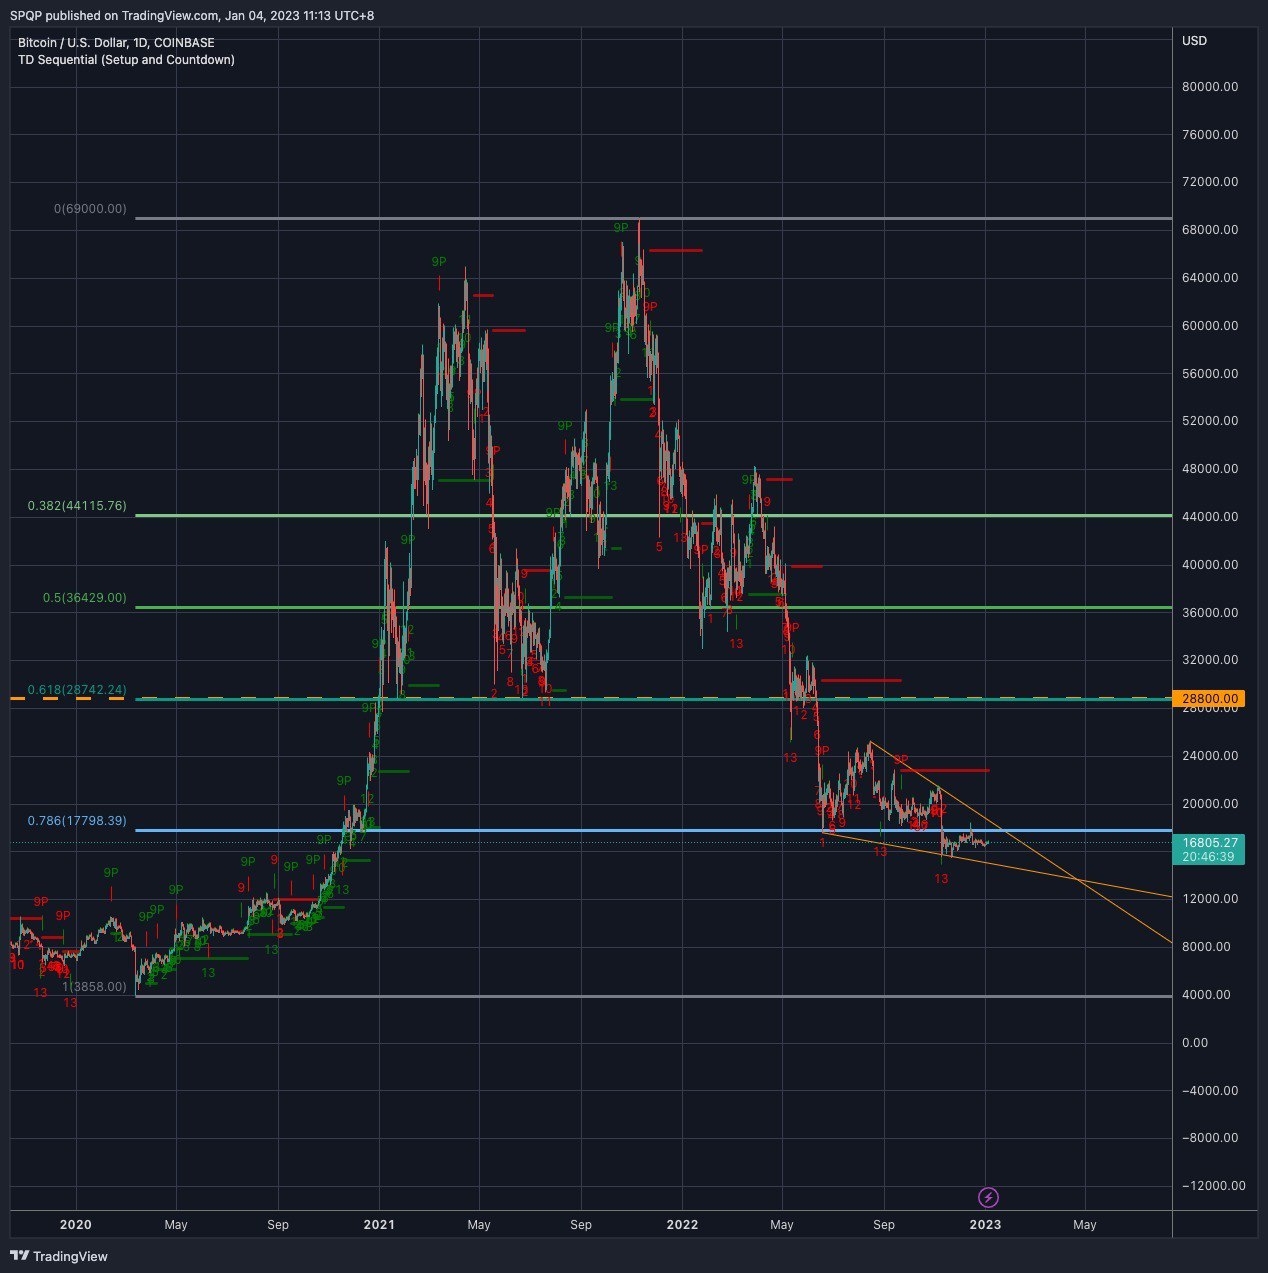 Bitcoin / USD, 1-day chart
According to QCP Capital, Ethereum “remains significantly more bullish than BTC,” though ETH is also trading in a consolidation pattern. Investors should keep an eye on the top of the triangle at $1,400 for now, before the key resistance zone between $1,700 and $2,000 could be targeted. On the downside, the company expects $1,000-$1,100 to be a very good support.
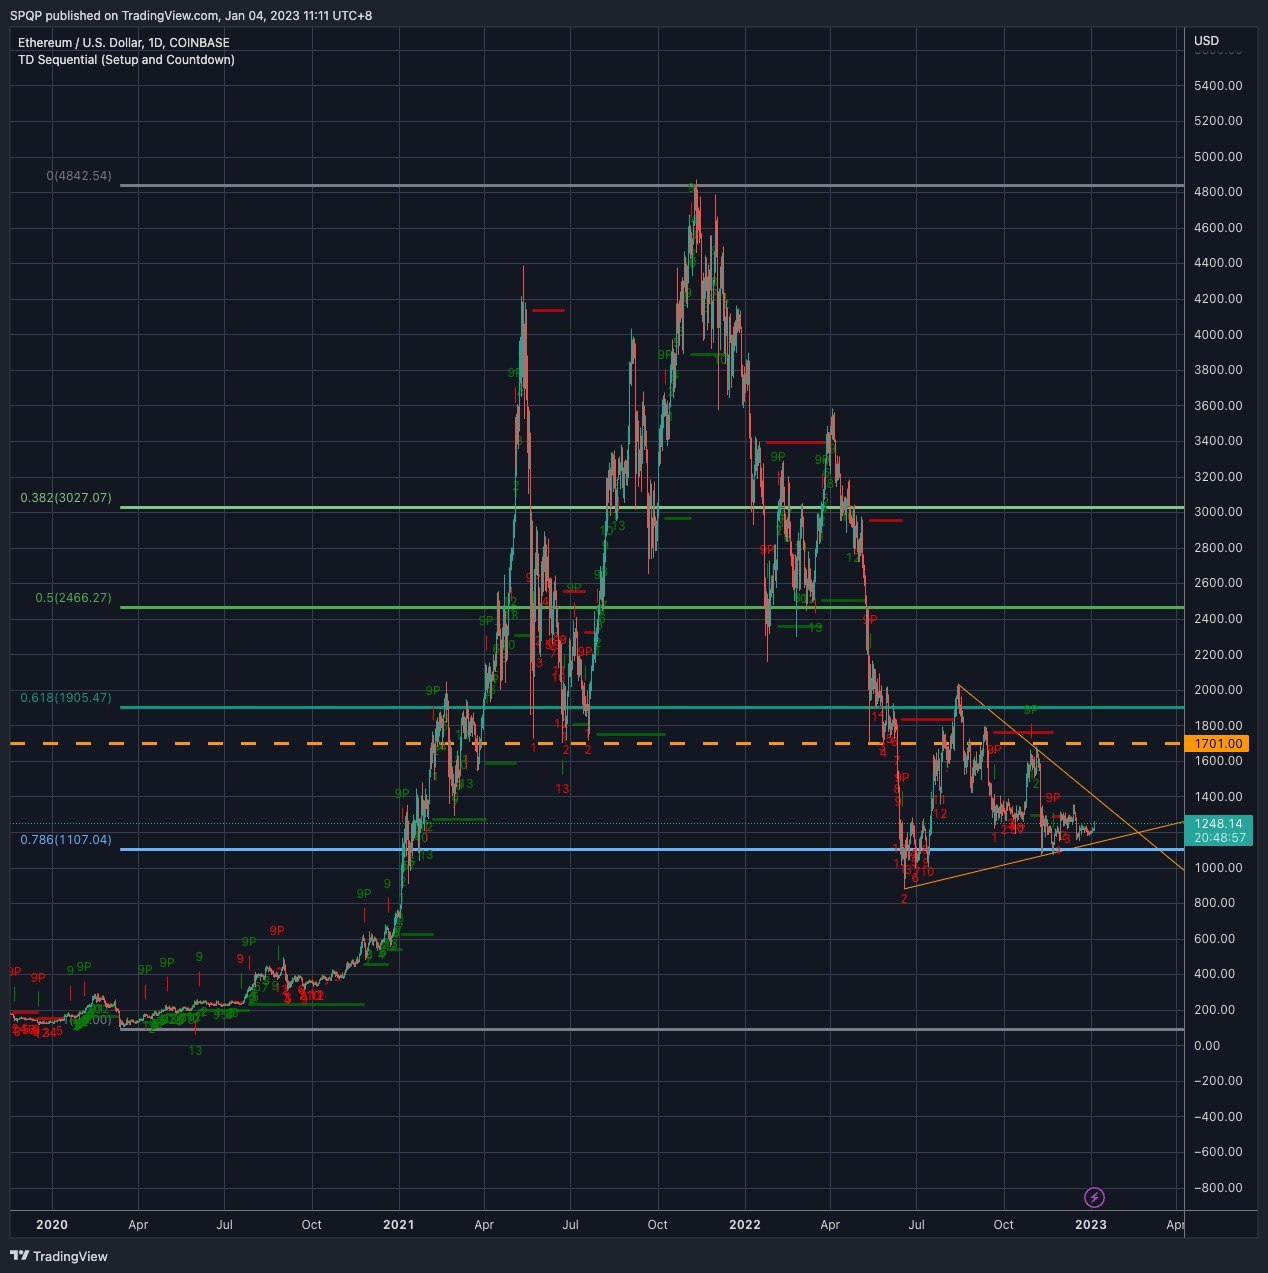 Ethereum / USD, 1-day chart
The Macro Outlook For 2023
Probably decisive for whether 2023 will be a continuation of 2022 will be the macro environment. QCP Capital believes that inflation in the U.S. will fall significantly, but not enough to reach the Fed’s 2% target.
This will cause the Fed to delay cutting rates as long as possible, as Jerome Powell does not want to be the guy in charge who makes the same mistake as in the 1970-80s when there was a “double-dip inflation era.”
This will lead to the Fed developing a “blinkered” mentality toward the far better numbers and making another mistake by easing monetary policy too late. “In a sad twist of fate, they will again wait too long and have to go into overdrive again,” the firm claims and concludes:
We expect this could only come in Oct-Nov again this year, but remain open minded to markets bottoming sooner than that.
At press time, the BTC price stood at $16,847, seeing a slight gain of 0,59% in the last 24 hours.
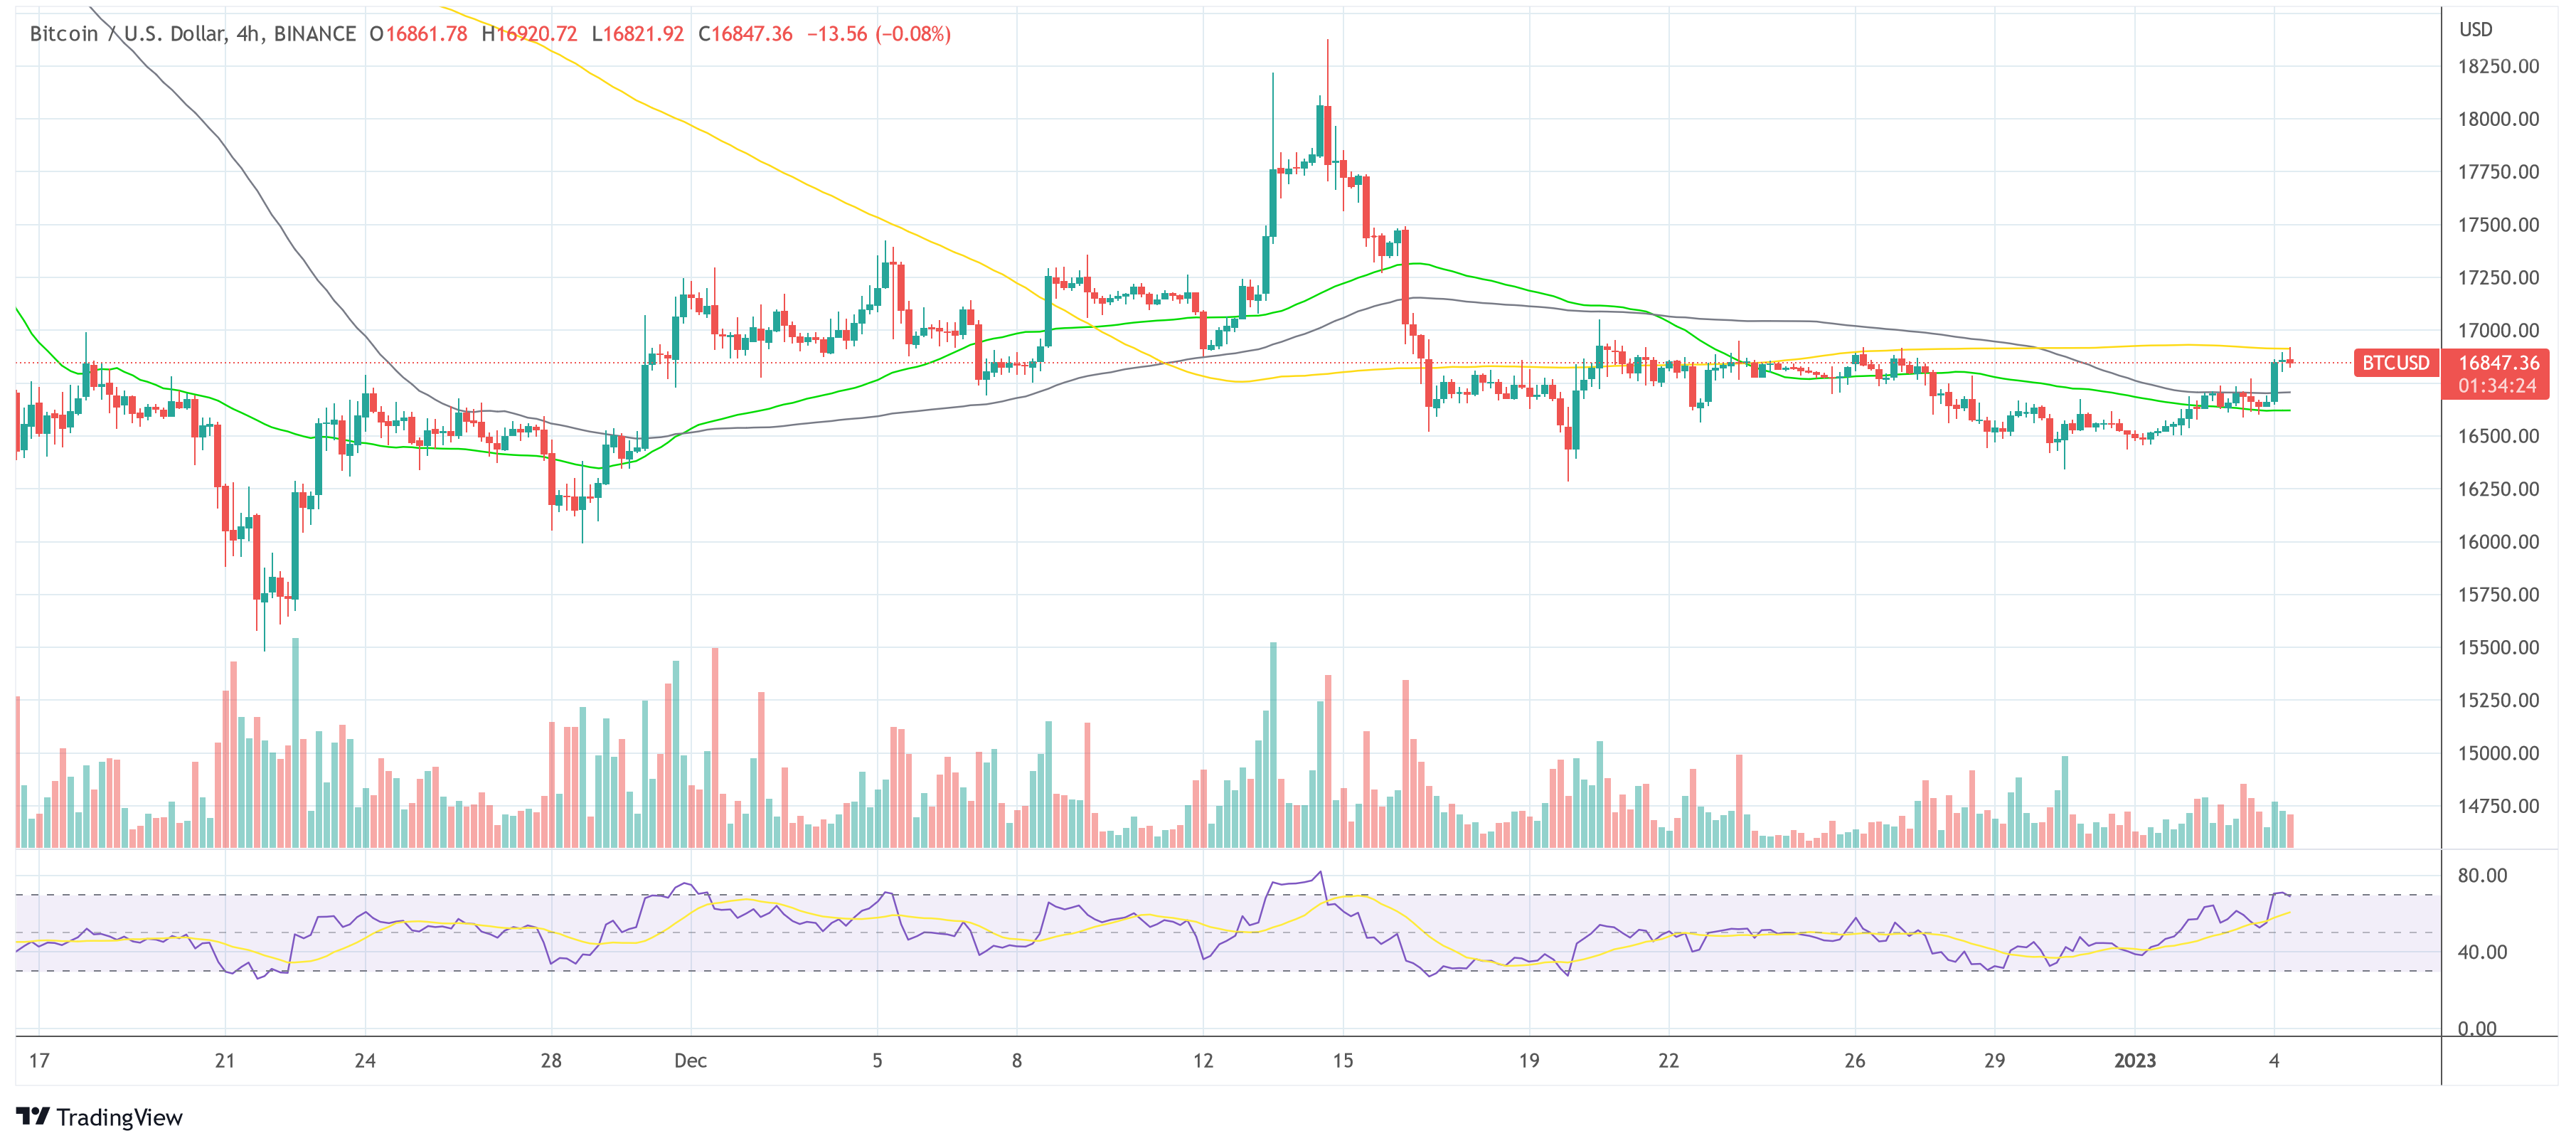 Bitcoin price, 4-hour chart