
Nano (NANO)
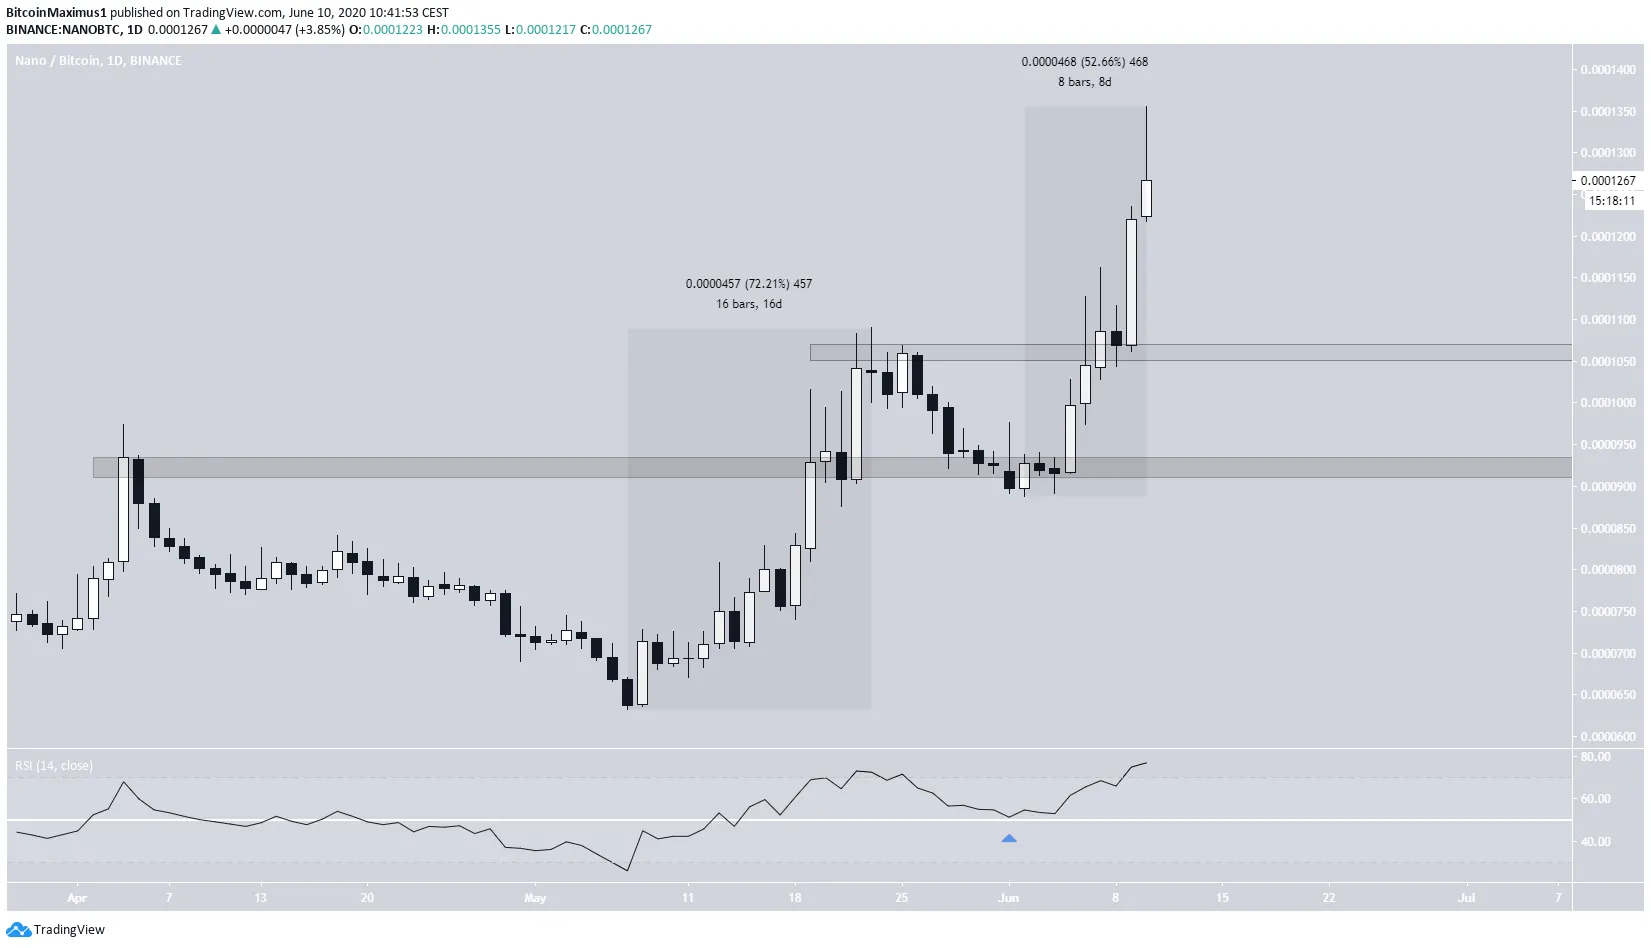
The NANO price has been increasing since May 8, when it reached a low of 63,660 satoshis. The increase took place in two phases:
- First, the price moved upwards by 72% in 16 days.
- Afterward, it returned and validated the 92,000 satoshi area as support, beginning the current upward trend.
Since then, NANO has increased by 52% in 8 days before retracing slightly. The daily RSI bounced at 50 around the same time the price bounced at the 92,000 satoshi support area, typical of a continuation move.
 NANO Chart By Tradingview
A very similar chart showing the previous increase and the bounce above support and the 200-day moving average (MA) was given by Cryptocurrency trader @PostyXBT. He notes similarities between the NANO and ADA price movements:
Not the most obvious alts to pair up but I’m seeing similar PA. Nano retraced 15% after a decent run, which made a higher low(HL) and the higher high followed. First box on ADA would be a 15% retrace and also a HL. Just like COVID, #ADA could see a second wave.
 Source: Twitter
Indeed, there are some similarities between the upward movements of the two coins, as shown in the image below. If they persist, ADA will find support above 800 satoshis and begin another upward move.
ADA Chart By Tradingview
Cardano (ADA)
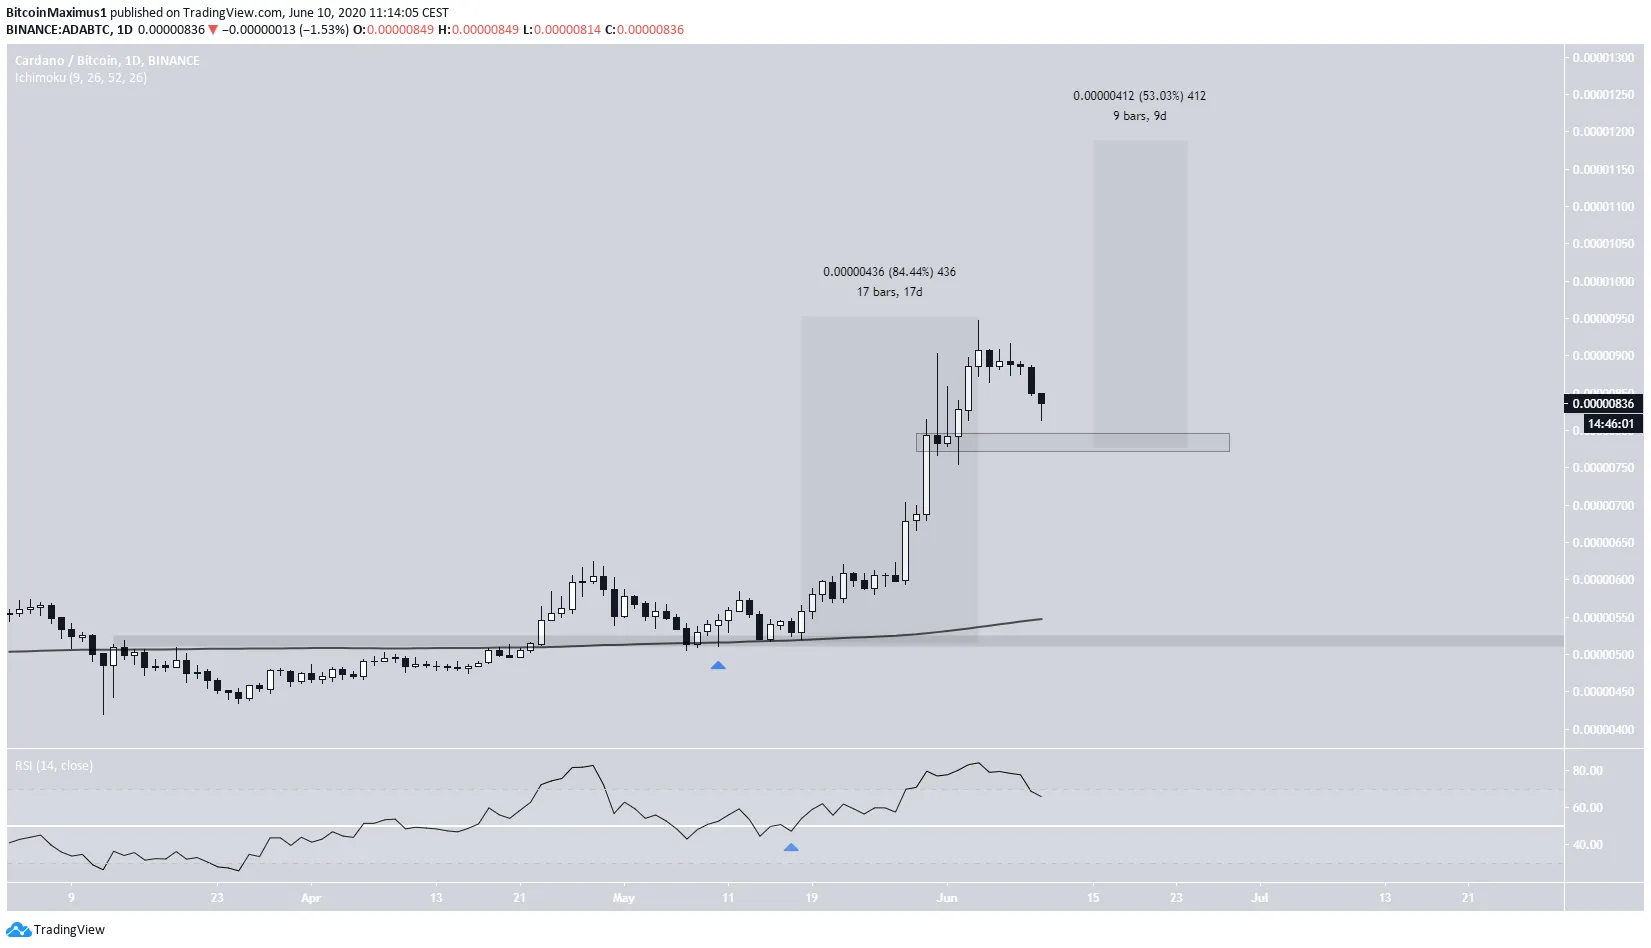
Beginning on May 18, ADA increased by 84% over 17 days, very similar to the NANO upward move. ADA has been retracing ever since. If the movement that follows is similar to that of NANO, the price will find support at 800 satoshis before beginning another rally that could take it to the next resistance area at 1200 satoshis. However, technical indicators throughout the climb have been dissimilar to those of NANO. The RSI bounced at the 50 MA line, and a price bounce at the 200-day MA occurred much earlier, on May 12. Therefore, besides the rate of increase, the ADA and NANO price movements are somewhat different.
 ADA Chart By Tradingview
A closer look shows that one support area can be identified more precisely at 780 satoshis, the 0.5 Fib level of the entire move. The next one sits at 740 sats. The price seems poised to at least reach the first support level. Once that level is reached, price movements and technical readings will determine whether ADA will continue in the same direction. Savvy traders will need to keep their eyes peeled for a possible double bottom and/or bullish divergence. Despite the similarities, as of right now, the price movement of NANO cannot be confidently used to predict that of ADA.