The Cardano (ADA) chart has been decreasing since reaching a high of $0.41 on Jan. 18.
Despite the rejection, ADA has reclaimed the previous breakout level and should resume its upward movement towards $0.45.
Long-Term Levels
The weekly chart shows that ADA is trading right at the long-term $0.38 resistance area, which is the 0.382 Fib retracement level when measured from the all-time high Dec. 2017 price.
Despite being right at resistance, technical indicators are still bullish. If ADA were to break out, the next resistance area would be at $0.61, the 0.618 Fib retracement level of the same move.
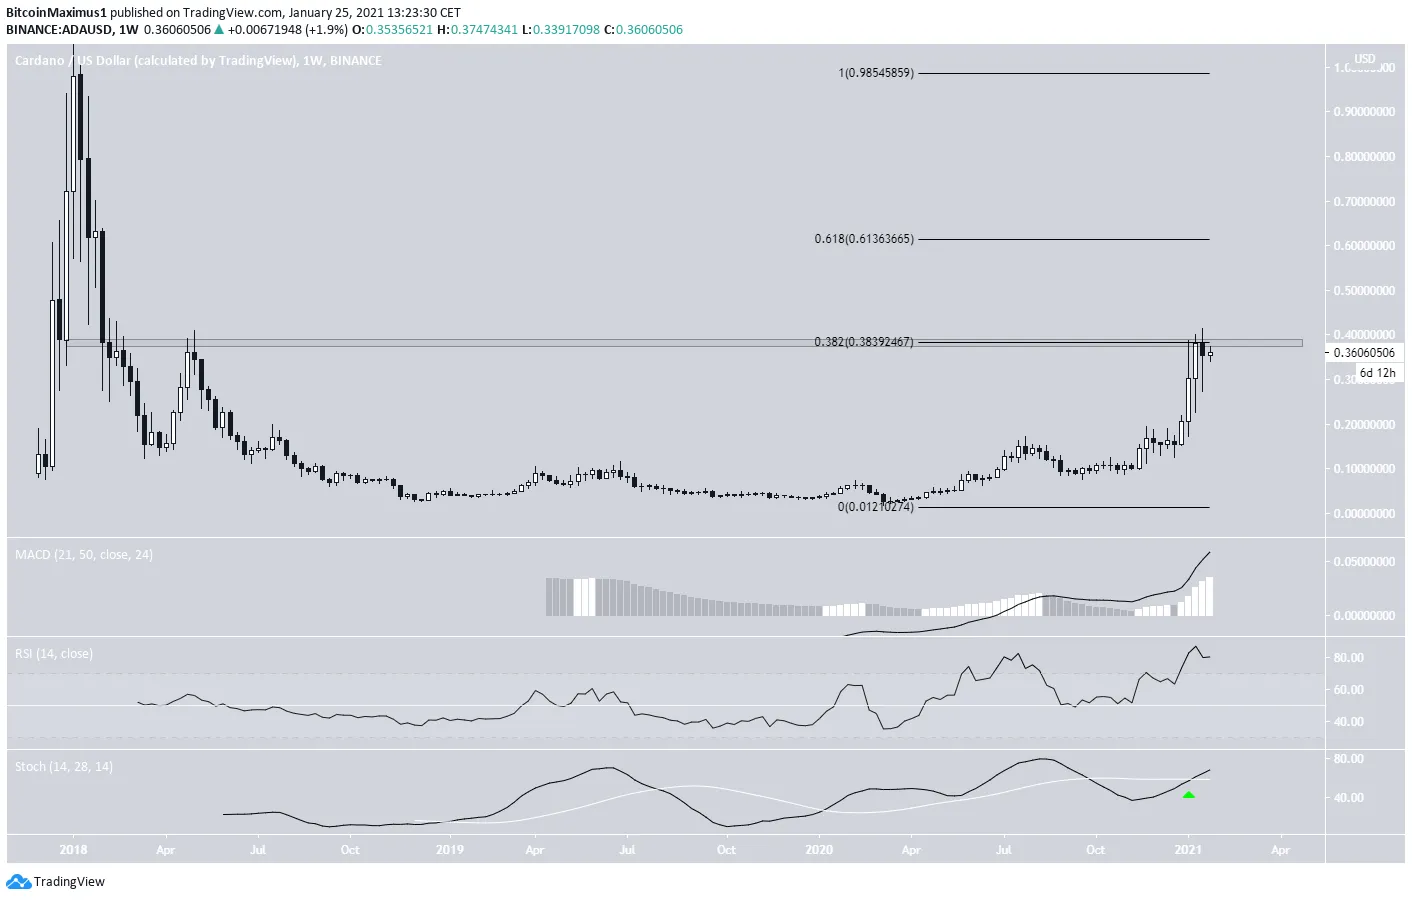 Chart By TradingView
Future Movement
The daily chart gives somewhat ambiguous signs.
While there is a hidden bullish divergence in the RSI during the most recent two lows, the MACD is falling, and the Stochastic Oscillator has just made a bearish cross.
/Related
MORE ARTICLES
Is This What the Bitcoin (BTC) Price Bottom Looks Like?
How Litecoin (LTC) Price Will Perform Ahead of August’s Halving
Do Kwon Suggests Sicking FBI on Man Who Accidentally Received $1.5M in LUNA
Why Is the Crypto Market Up Today?
BlockFi To Reveal Financial State Post FTX Collapse and Bankruptcy Filing
Will Crypto Volatility Crunch Precede an Explosive Move for BTC and ETH?
Therefore, the daily chart doesn’t provide enough data to confidently predict a breakout above the long-term $0.38 resistance area.
Chart By TradingView
Nevertheless, the shorter-term six-hour chart is slightly more bullish. It seems that ADA has reclaimed the $0.34 area after initially dropping considerably below it (shown with the red circle).
These reclaims are often bullish signs that eventually lead to the continuation of the upward move. Furthermore, the MACD is increasing, supporting the possibility of continuation.
Chart By TradingView
Wave Count
The wave count suggests that ADA is in a long-term wave 3 (white) of a bullish impulse that began with the March lows. If correct, ADA is currently in sub-wave 5 (orange) of this long-term wave 3.
The most likely target for the end of the wave is between $0.455 and $0.488, found by a combination of Fib extensions (white), projections (orange), and external retracements (black)
Chart By TradingView
ADA/BTC
Cryptocurrency trader @DTCCryptoTrading outlined an ADA/BTC chart that shows a breakout and retest above an important resistance area.
Source: Twitter
The previous resistance area is at 960 satoshis, and previously, ADA had been trading below it since Sept. 2020. On Jan. 21, it validated it as support and has been increasing since.
While there is resistance at 1175, the 0.618 Fib retracement level of the entire previous downward move, there is virtually no resistance above it until 1,600 satoshis.
Technical indicators are bullish and support the possibility that ADA will break out towards 1,600 satoshis.
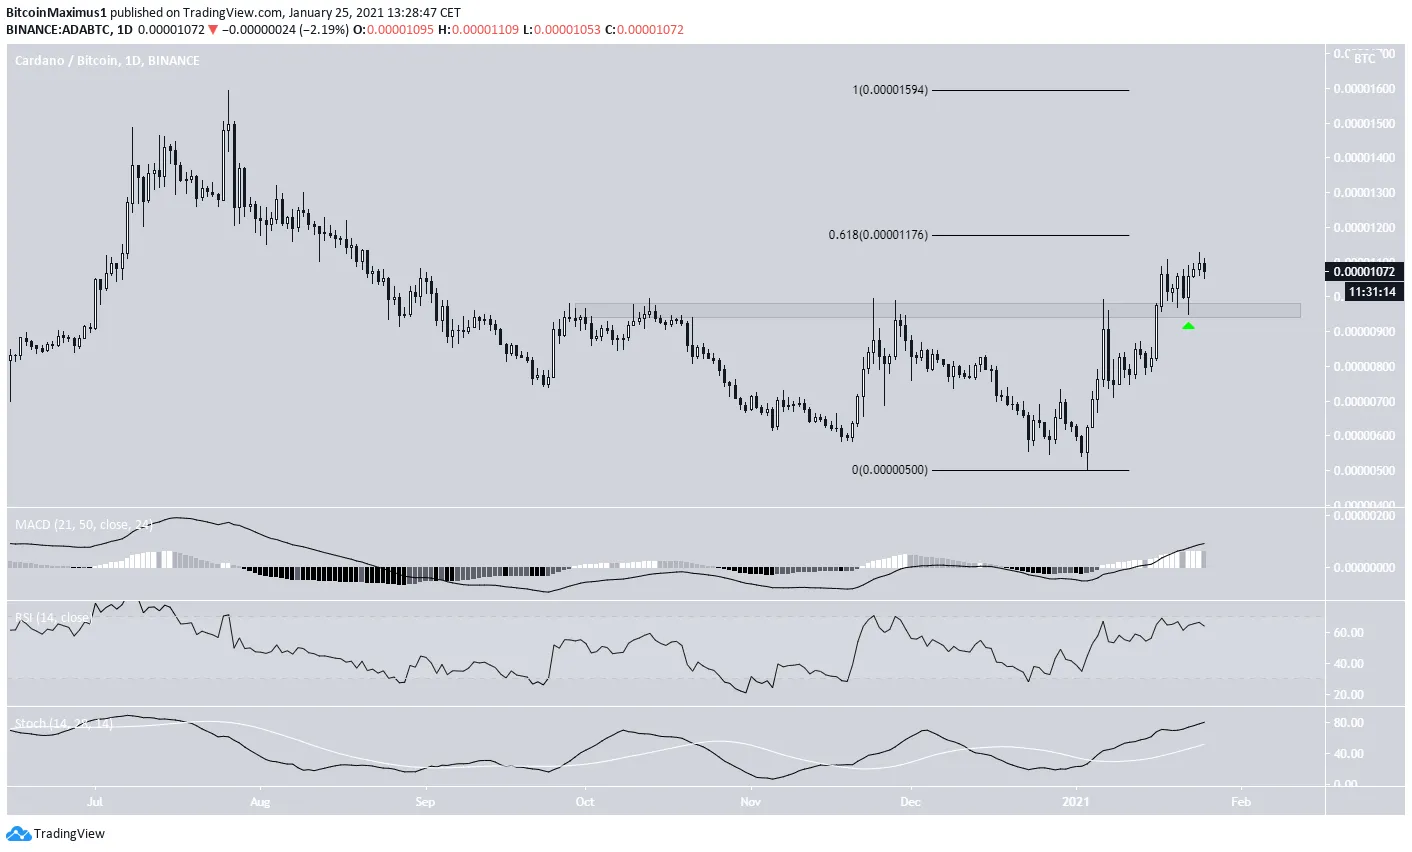 Chart By TradingView
Conclusion
To conclude, ADA should continue rallying towards $0.43, completing the final sub-wave of the current upward movement.
Additionally, ADA/BTC is likely to move above the current resistance area and gradually increase towards 1,600 satoshis.


