BeInCrypto takes a look at the price movement for seven altcoins, including Shiba Inu (SHIB), which is in the process of breaking out above a large descending resistance line.
BTC
Bitcoin (BTC) has been following a descending resistance line since Nov 10. At the time, it had just reached a new all-time high price.
The line currently coincides with the $59,350 resistance area. This is both a horizontal resistance area and the 0.382 Fib retracement resistance level.
Until it is broken, the trend cannot be considered bullish.
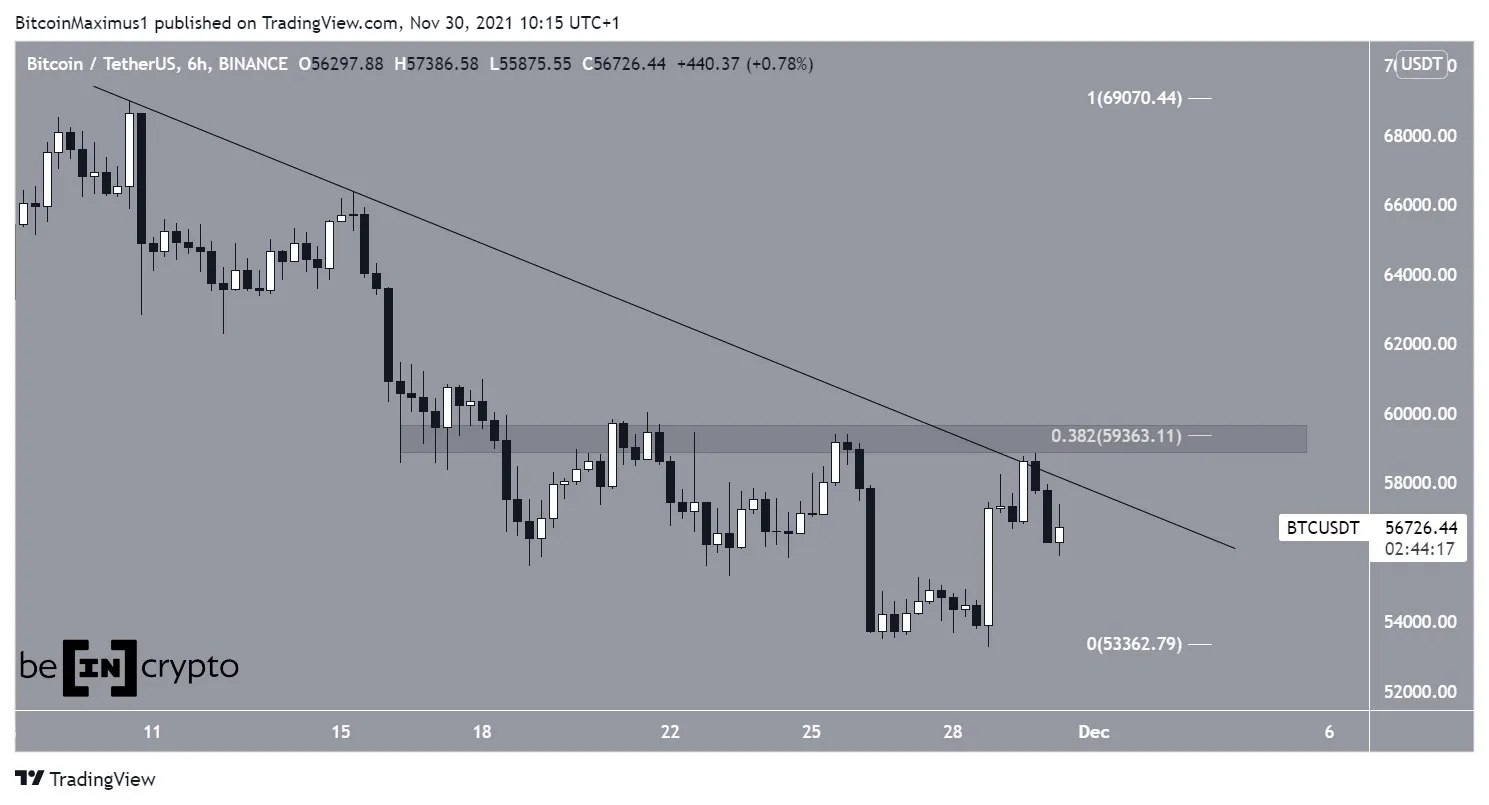 BTC Chart By TradingView
ETH
Similar to BTC, Ethereum (ETH) has been falling since Nov 10 after reaching an all-time high price of $4,867. It has been decreasing underneath a descending resistance line since then.
/Related
MORE ARTICLES
Crypto Bank Juno Urges Customers to Self-Custody After Reports of Wyre Shuttering
Binance Coin (BNB) Price Buoyed by News of Acquisition
Gaming Giant Animoca Scales Back to $1B Web3 Funding Amid Weak Market
Why Is the Crypto Market Down Today?
How Ethereum Liquid Staking Platforms Could Benefit From Shanghai Upgrade
Digital Yuan CBDC Pilot ‘Running Steadily,’ Affirms People’s Bank of China
The line coincides with the $4,500 horizontal resistance area.
If it’s able to break out above this resistance, ETH is likely to increase towards a new all-time high price.
ETH Chart By TradingView
XRP
On Nov 28, XRP bounced (green icon) at the $0.95 horizontal area. With the exception of a deviation between Sept 20-27, it has been trading above this level since the middle of August. As long as the price remains above it, the bullish structure remains intact.
If the upward move continues, the closest resistance area would be found between $1.06-$1.11. This is the 0.382-0.5 Fib retracement resistance level.
XRP Chart By TradingView
ADA
On Nov 16, Cardano (ADA) broke down from the $1.95 horizontal area. It validated the level as resistance two days later (green icon).
Afterward, it continued falling until it reached a local low of $1.41 on Nov 28. There, it initiated another bounce.
If the increase continues, the $1.95 area would be expected to act as resistance once again.
ADA Chart By TradingView
SHIB
Shiba Inu (SHIB) had been following a descending resistance line since Oct 28, when it reached a then all-time high price of $0.000088. This led to a low of $0.000035 on Nov 26. On Nov 29, it managed to break out from the line.
It is currently attempting to break out from the $0.00005 resistance area. If successful, the next resistance would be at $0.000062.
SHIB Chart By TradingView
STX
Stacks (STX) had been decreasing beneath a descending resistance line since Oct 18.
Similar to SHIB, it broke out above the line on Nov 30, ending its short-term correction. It’s currently attempting to break out from the $2.45 horizontal area. Doing so could lead to a new all-time high price.
STX Chart By TradingView
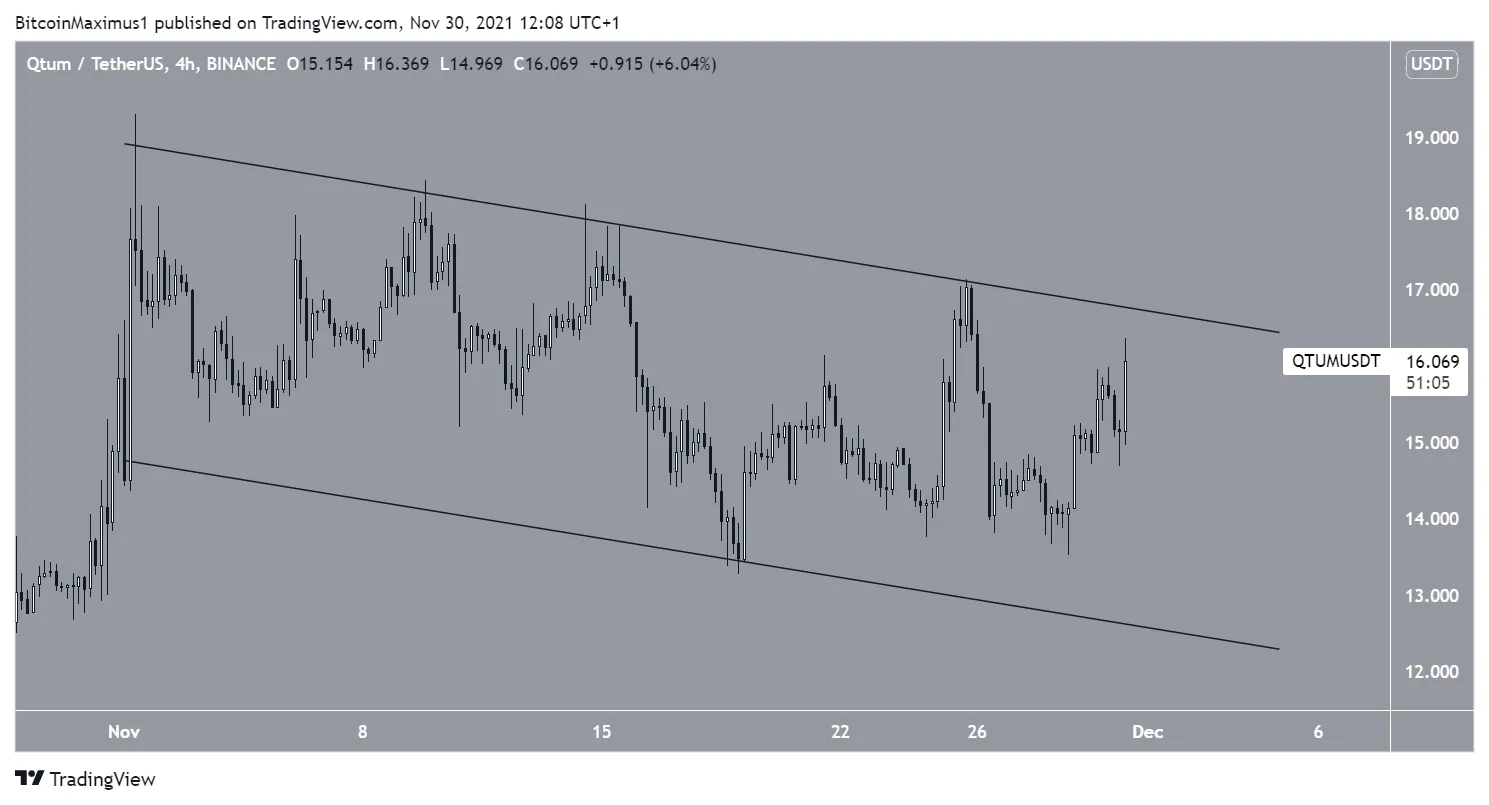
QTUM
Qtum (QTUM) has been trading inside a descending parallel channel since Oct 21. Such channels usually contain corrective movements. This means that a breakout would be expected. QTUM is currently trading in the upper portion of the channel, further affirming this possibility.
If it manages to break out, QTUM could move toward the yearly highs at $35.