Solana (SOL) initiated a small upward movement after the Ethereum (ETH) merge. While Cardano (ADA) is lagging behind, Binance Coin (BNB) might have begun a bullish trend reversal.
The Ethereum (ETH) merge went live on Sept. 15, completing the transition from a proof-of-work (PoW) to a proof-of-stake (PoS) protocol.
After the merge, the Ethereum Classic (ETC) hash rate jumped to 222.50 hashes per second, a more than 200% increase since Sept. 13. It is likely that Ethereum miners have now flocked to ETC, in turn causing the increase in hash rate.
Until now, sustainability has been the main selling point of some Layer 1 solutions such as Solana (SOL) and Polygon (MATIC) over ETH. This was one of the reasons why Starbucks chose to launch its NFT video game on Polygon.
Now, with the switch to PoS, the protocol will use 99.95% less electricity, thus negating the main advantage of other ”Ethereum killers”.
/Related
MORE ARTICLES
Avalanche (AVAX) Price Is Edging Closer to a Bullish Breakout

JP Morgan Still Dabbling in Crypto, but Is the Bank Serious About Adoption?
Crypto.com (CRO) Price May Dip Further in Search of Support

Bitcoin Will Reach $33,000 in April 2023 – Cycle Analysis
What Bear Market? Web3 Investments Soared in 2022, up $4.5B on Previous Year
Crypto Tax Pushes Indian Users to Switch to Foreign Exchanges; Government Revenue Hurt
With that in mind, it is interesting to see if the price of these assets has changed in response to the switch.
SOL
SOL had been increasing inside an ascending wedge since reaching a low on June 13. The entire movement was contained inside an ascending wedge, which is considered a bearish pattern.
The price managed to reach a high of $48.38 on Aug. 13 before falling and breaking down from the wedge on Aug. 19.
After the breakdown, SOL attempted to initiate an upward movement but was rejected by the $39.25 resistance area on Sept. 13, creating a bearish engulfing candlestick (red icon). This is the 0.5 Fib retracement resistance level and a horizontal resistance area.
Until SOL manages to reclaim this level, the trend cannot be considered bullish.
SOL/USDT Chart By TradingView
ADA
Since the Aug. 2021 all-time high, ADA seems to be in a five-wave downward movement (black). In this case, ADA is now in wave four, which is noticeable by the shape of the symmetrical triangle.
If the count is correct, the price will break down from the triangle and then fall towards one of the closest support levels at $0.32 or $0.22. The targets are given by the 1.27 and 1.61 external Fib retracement levels respectively when measuring the height of the triangle.
Whether the price breaks out from the $0.594 high (green line) or breaks down from the $0.427 low (red line) will likely determine the direction of the future movement.
ADA/USDT Chart By TradingView
BNB
Measuring from the June lows, BNB seems to have completed a five-wave upward movement that led to the $337 high on Aug. 10. Since then, it fell underneath a descending resistance line in what seems to be an A-B-C corrective structure.
On Sept. 8, BNB broke out from this descending resistance line and is currently in the process of validating it as support (green icon). If successful, another upward movement would be likely.
If BNB falls below the line instead, it would be expected to re-test the 0.618 Fib retracement support level at $242.
BNB/USDT Chart By TradingView
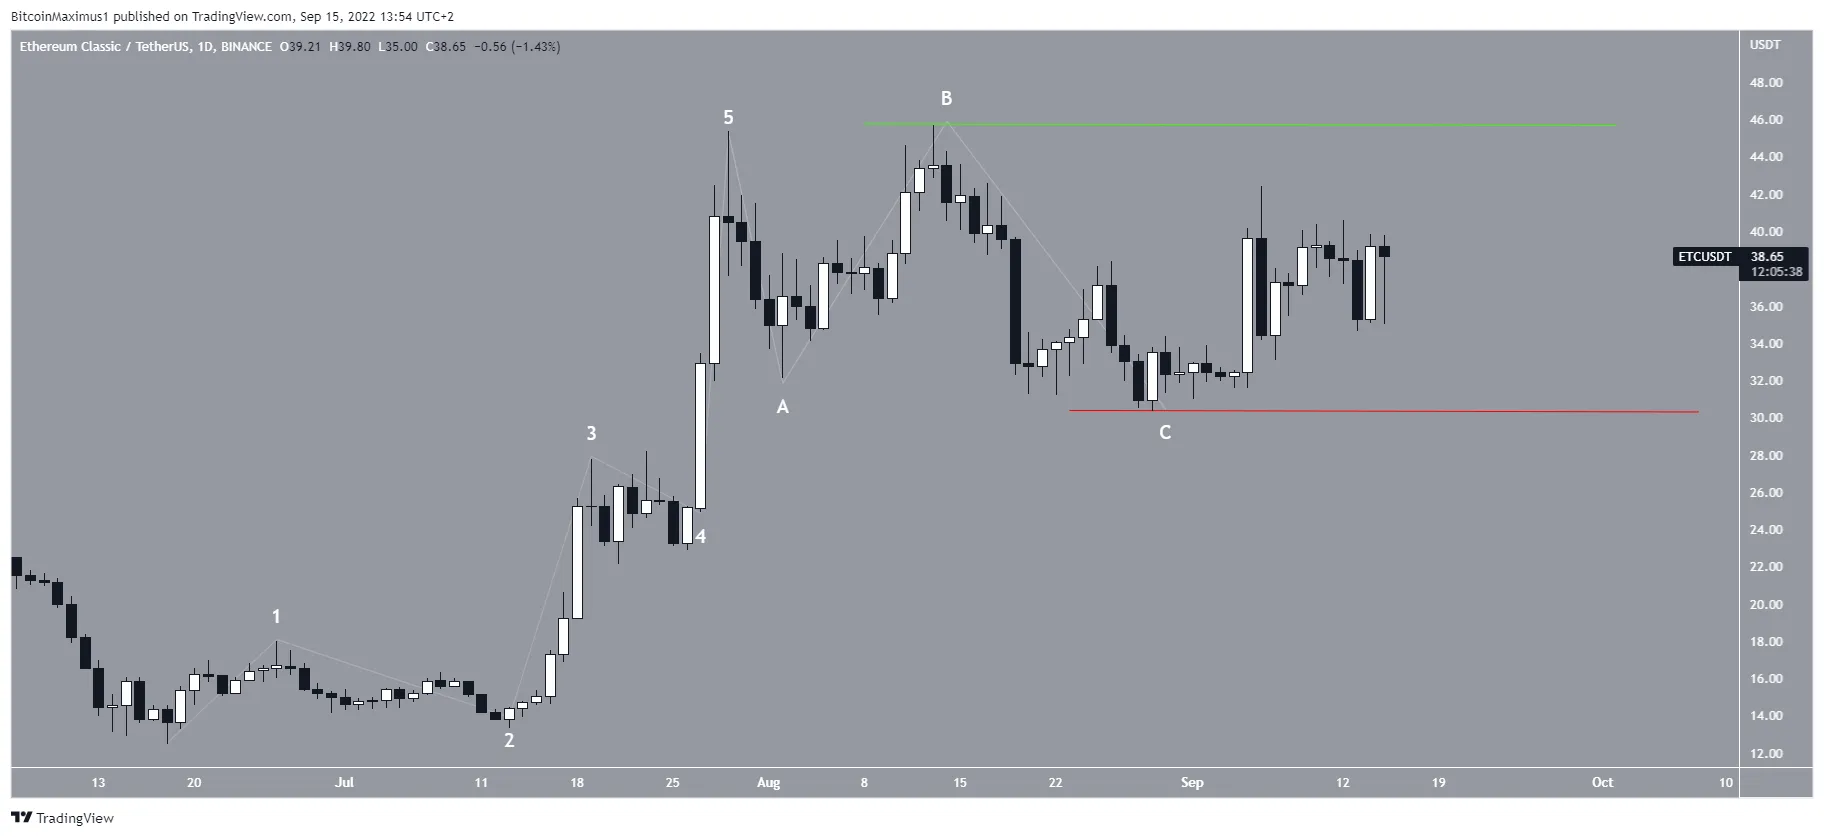
ETC
The ETC movement is very similar to that of BNB. The price seems to have completed a five-wave upward movement and then an A-B-C corrective structure.
While it is not yet certain if the correction is complete, whether the price breaks out from the $45.71 high (green line) or falls below the $30.34 low (red line) will likely determine the direction of the future trend.