
Cardano (ADA) fell to a new yearly low on April 30 but bounced shortly afterward. Despite the bounce, technical indicators do not confirm the bullish reversal.
ADA had been decreasing underneath a descending resistance line since reaching an all-time high price of $3.10 on Sept 2. The downward movement led to a low of $0.74 on Feb 24.
ADA regained its footing afterward and managed to break out from the line on March 23. However, the upward movement could not be sustained and the price returned to $0.70 at the beginning of May. Relative to the price in March, this created a double bottom, which is considered a bullish pattern.
/Related
MORE ARTICLES
FTX: How to Prevent a Similar Dumpster Fire
FTX Japan Will Begin Customer Refunds In February 2023

Pi Network (PI) Listing Sparks Controversy as Price Skyrockets

Stablecoins Dominate the Trading Volume in the Last Crypto Friday of 2022
This Week in Crypto: SBF Gets Bail, Solana Dumpster Fire Continues and Could BNB Be a Security?
AI Chatbots Could Become the Future of the Metaverse
If an upward movement transpires as a result of this pattern, the closest resistance area would be at $1.55.
Chart By TradingView
Double bottom pattern
Even though the double bottom is considered a bullish pattern, it has not been combined with a bullish divergence in the RSI or the MACD. On the contrary, both indicators are decreasing and are providing bearish readings.
More importantly, the descending trendline in the RSI is still intact, which suggests that the trend is still bearish.
Chart By TradingView
Despite the bearishness from higher time frames, the six-hour chart suggests that a short-term bounce could transpire.
The reason for this is that ADA has broken out from a short-term descending resistance line and is in the process of validating it as support.
If an upward movement follows, the closest resistance area would be between $0.93 and $0.99. These are the 0.382 to 0.5 Fib retracement resistance levels.
Chart By TradingView
ADA/BTC
The ADA/BTC pair is more bullish than its USD counterpart. The main reason for this is that the same double bottom in the daily time frame has been combined with a bullish divergence in the MACD (green line).
Additionally, the RSI has broken its descending trendline and is now attempting to move above 50.
As a result of this, it is possible that an upward movement towards the yearly highs at 2,600 satoshis will follow.
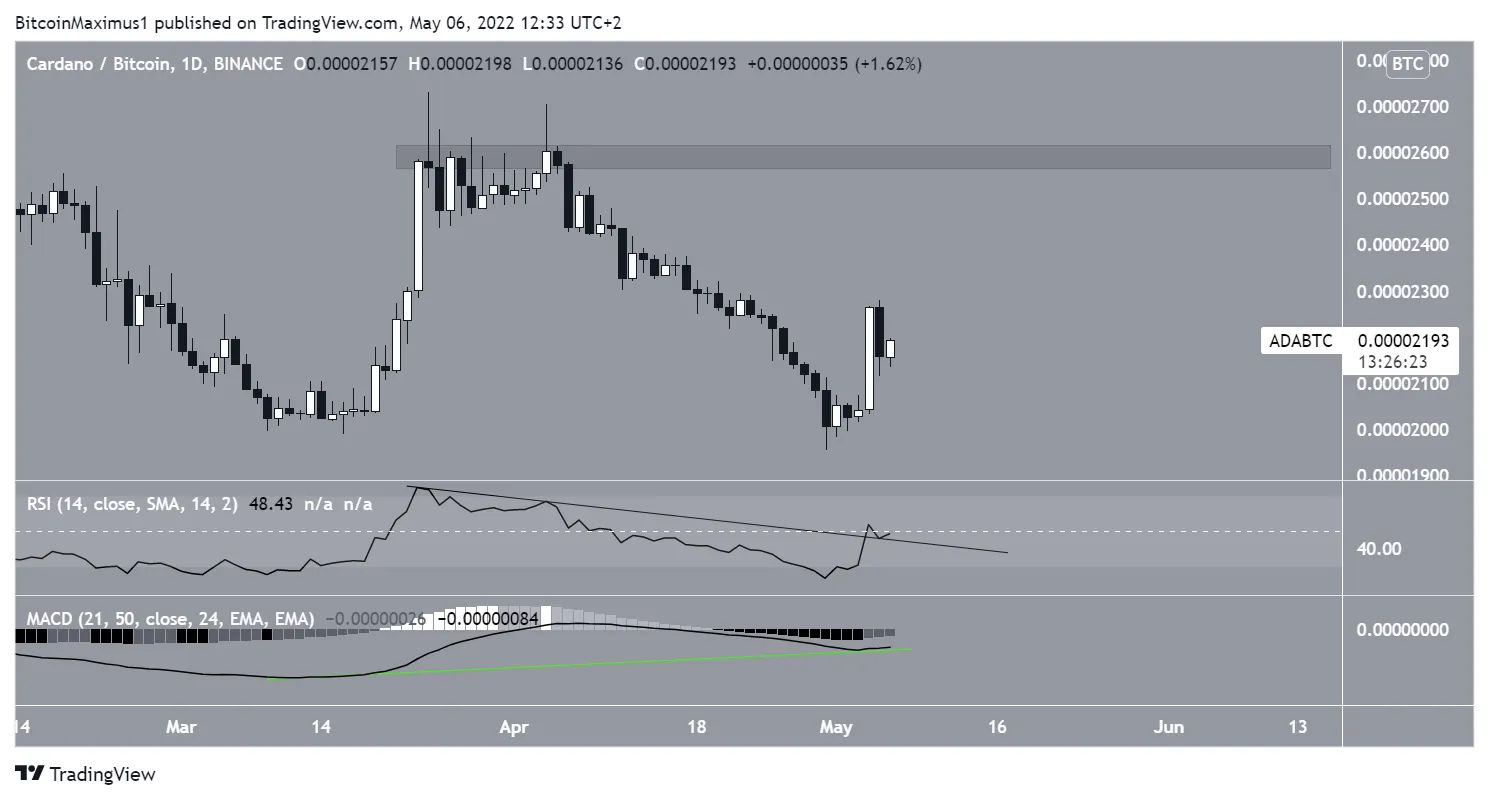 Chart By TradingView